
The High Tight Flag
The most bullish pattern that ever existed. How to trade it, & why is it a good indicator of a voluptuous Bull market?

In this article, I will explain:
What is a Flag pattern?
What is a High Tight Flag (HTF) pattern?
What is the price target for an HTF?
How to Trade an HTF?
A live example of HTF in the market.
Why is the HTF a good indicator of a Bull market?
How to scan for HTFs?
(Links to “25-HTFs with Homma videos” at the end of the article)
What is a Flag pattern?
A FLAG is a bullish pattern, consisting of an UPTREND which forms the POLE; followed by a base which forms the flag MAST.
The basing period is generally shorter than twice the up-trending period (a longer mast would look like a flat base or a descending channel, but I digress).
A healthy mast should pull back not more than 40% of the pole length.
The mast can be pointing upwards, flat, or downwards.
The mast can take the shape of a channel or have converging trendlines (in which case it is called a pennant, Potaeto, Potato).
The volume dries up inside the mast, which is considered very constructive for the pattern.
Now, if there is any strength left in the stock, it eventually breaks out of the mast and resumes the uptrend. This uptrending move could be as big as the size of the flag pole itself.

What is a High Tight Flag (HTF) pattern?
HTF is just a flag with the following characteristics:
The flag pole is > 100% measured from the bottom (or a swing low) and takes around 6-10 weeks.
The flag mast pulls back less than -25% from the pole top.
Mast formation completes between 3-5 weeks before a breakout.
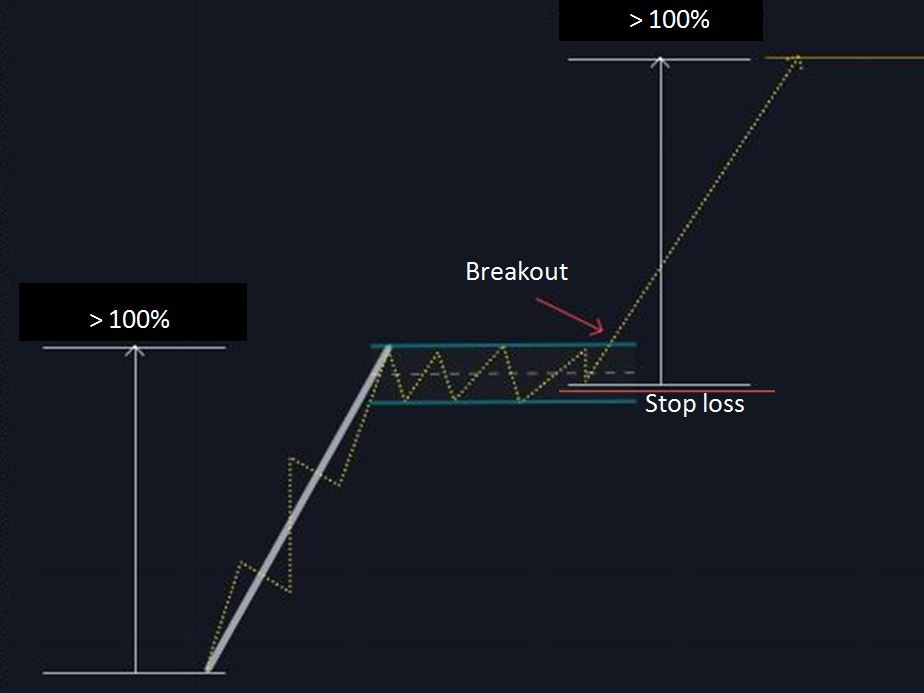
This pattern represents the extreme strength of the stock/instrument. The same strength propelled the stock 100% or more. The pullback of <25% tells us that, apart from a small profit-taking exercise, not many holders are selling and that most of them are holding onto their stock looking for even bigger gains. Eventually, this HTF breaks out. A higher volume as compared to the volume inside the mast is a high-confidence breakout.
What is the price target for an HTF?
Once and if the breakout occurs, the stock is likely (high probability, but <100%) to climb another length of the pole, projected from the swing low of the mast (figure below)
How to trade an HTF?
Depending on the shape of the mast, there are either one or two pivot points in an HTF (read more about the perfect entry and a pivot point here). An entry can be made a few points above this pivot with the Stoploss a few points below the swing low of the mast.
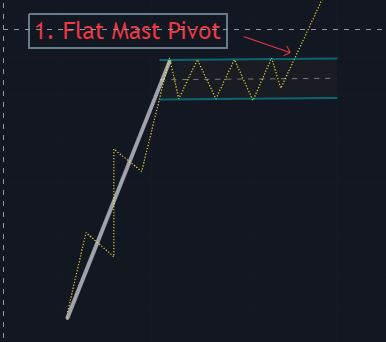
If the mast is a flat structure, the resistance of the mast is the same as the pole high, which is the only pivot.
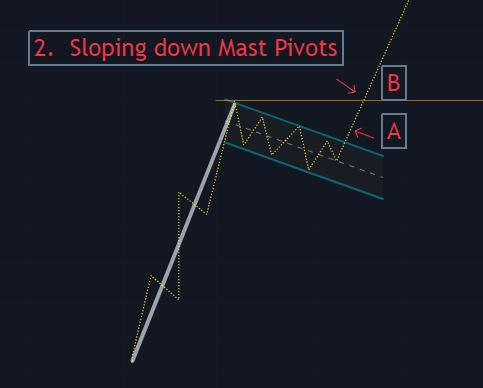
If the mast is sloping down, we have 2 pivots: a) the resistance of the descending mast and b) the high of the flag pole.
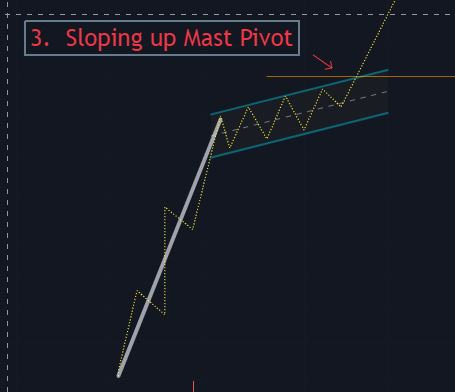
If the mast is sloping up, then the resistance of the ascending mast is a preferred pivot point over the pole high.
An ascending mast could either mean a very strong HTF or a faulty mast. The volume on the mast is a key factor to look at for distinguishing between these two.
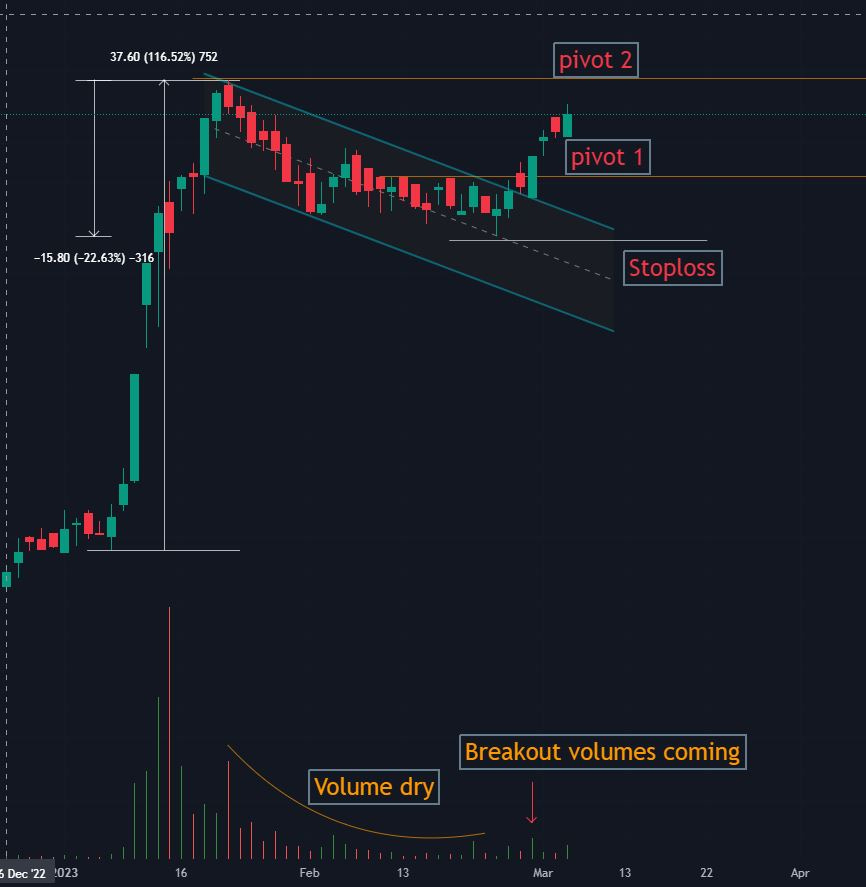
A live example of HTF breaking out currently in the market:
Gencon
Why is the HTF a good indicator of a Bull market?
HTF being a very bullish structure, appears the most during heightened bull markets. My preliminary observation is that the start of a raging Bull market will have the most number of HTFs.
Below is a histogram of HTF in the NSE universe for the last 4 years alongside Nifty 500 data.
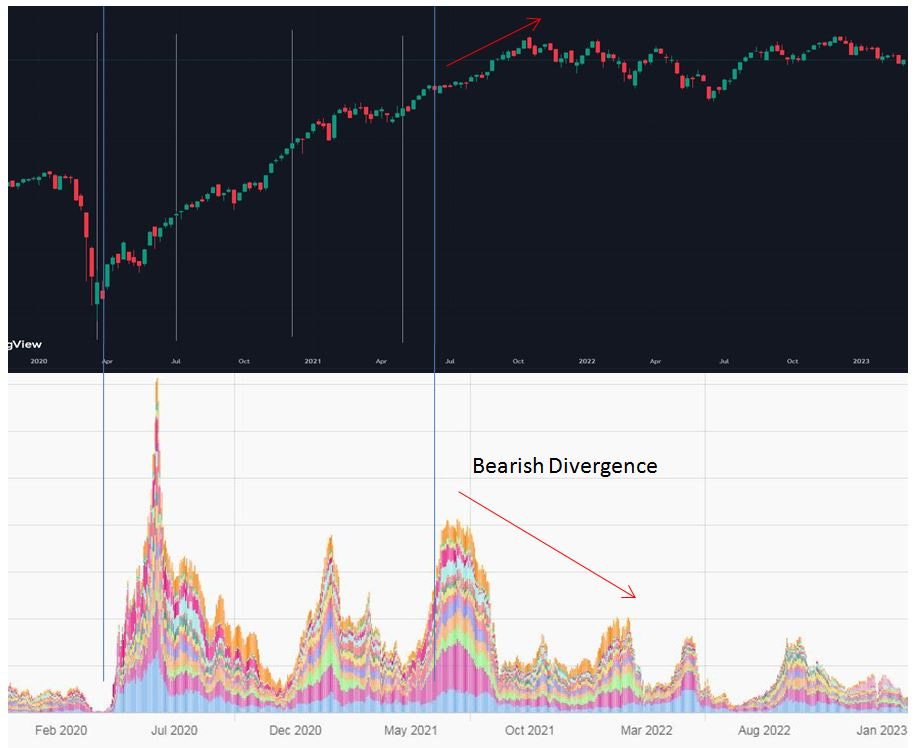
2 Key observations:
The highest number of HTF during April 2020, i.e, the start of the post-COVID bull market.
Bearish divergence with Nifty500 Tops vs HTF number before the market fell.
Numbers are almost at a historical low right now. Calm before the storm?
Therefore, the number of HTFs in the market can also serve as a key indicator of a bull market and a good indicator of an impending bear market.
How to scan for HTFs?
This is simple.
You can go to the scanner section of my website.
Click on “Select Scanner”.
Click on “The High Tight Flags”

Thats all for today,
If you are a beginner looking to SIMPLIFY your trading.
I conduct my Annual Beginners Trading Masterclass once a year (around July).
Last year, it was all about Trading Systems.
If you find my articles valuable, you will find the Masterclass 100 times more useful.
You can now take advantage of the recorded session.
Details of the masterclass are below.
Trading System Masterclass for Beginners
·
July 12, 2024

The Annual Sakatas Homma’s Beginners Trading Masterclass is finally here. This year, it will be all about the trading system. Your unique trading system. Excited! would be an understatement. Details Below.
That's all for today.
I also help traders build their trading systems and show mine daily in HPA (Homma Private Access).
(PS: 1-month free HPA access is complementary with the Masterclass)
Details below:
Homma Private Access membership:
HPA is a subscription-based educational service (on WhatsApp). Benefits include:
Daily Market Breadth, Momentum, Sector Rotation, and Relative Strength Update.
Access to all my proprietary scanner toolkits, including the BBB (buy before breakouts) scanner and the Homma Khela Hobe 2.0 scanner.
Access to my proprietary Breadth-Momentum-Relative Strength & Sector Rotation dashboards.
Access to my Trading View indicators: Mswing indicator, Homma Khela Hobe, Buy before Breakouts (BBB), etc.
HPA Weekly: Hourly weekend deep dives and Q&A.
1-year access to The Technical Take premium.
Access to the daily Ranked Mswing Relative Strength Top 100 watchlist.
Yearly membership of 15000/- INR only.
UPI payment & WhatsApp @9481506784
Yours
Sakatas Homma.
Socials and Hommacommunity:
Links to the 25-HTF with Homma deep dives on High Tight Flags: