
What is the perfect entry point?
Central dogma of a trade 3.1

This is a million-dollar question.
The answer to this is a billion-dollar answer.
As with all answers, the answer to this question can also be simplified. And that is what we are going to do today.
The perfect entry point is different for an intraday vs a swing/positional vs a long-term investor. Why?
Because they have different time horizons and naturally different risk appetites.
But let's first define what we mean by a perfect entry. A perfect entry is one which provides you with one or all of the following 3 states to your trade:
The lowest possible risk
The highest reward/risk ratio, &
The minimum opportunity cost
As we can now imagine, these 3 things will be different for different time frames, and hence,
Let’s now take each of the 3 states one by one and discuss how one can determine them.
The lowest possible risk:
This depends on multiple factors but mostly on your setup. Every set-up can be classified as one of these two: A continuation set-up or a reversal set-up.
Continuations can be further classified as a Breakout or a pullback. (Another way to classify a set-up is to look at it as either a confirmatory or an anticipation set-up. Here we will be talking about the confirmatory set-ups only.)
Irrespective of the set-up you are using, there will be a price point beyond which the odds (or probability) of your set-up working becomes significantly higher. This point in technical analysis lingo is called “the PIVOT point”.
Now, there will be another price point in the opposite direction beyond which the setup fails, where the odds (or probability) of your set-up failing becomes significantly higher. This price point is your “ideal STOP LOSS”.
The difference between the Pivot and the ideal stop loss is your “LOWEST POSSIBLE RISK”.
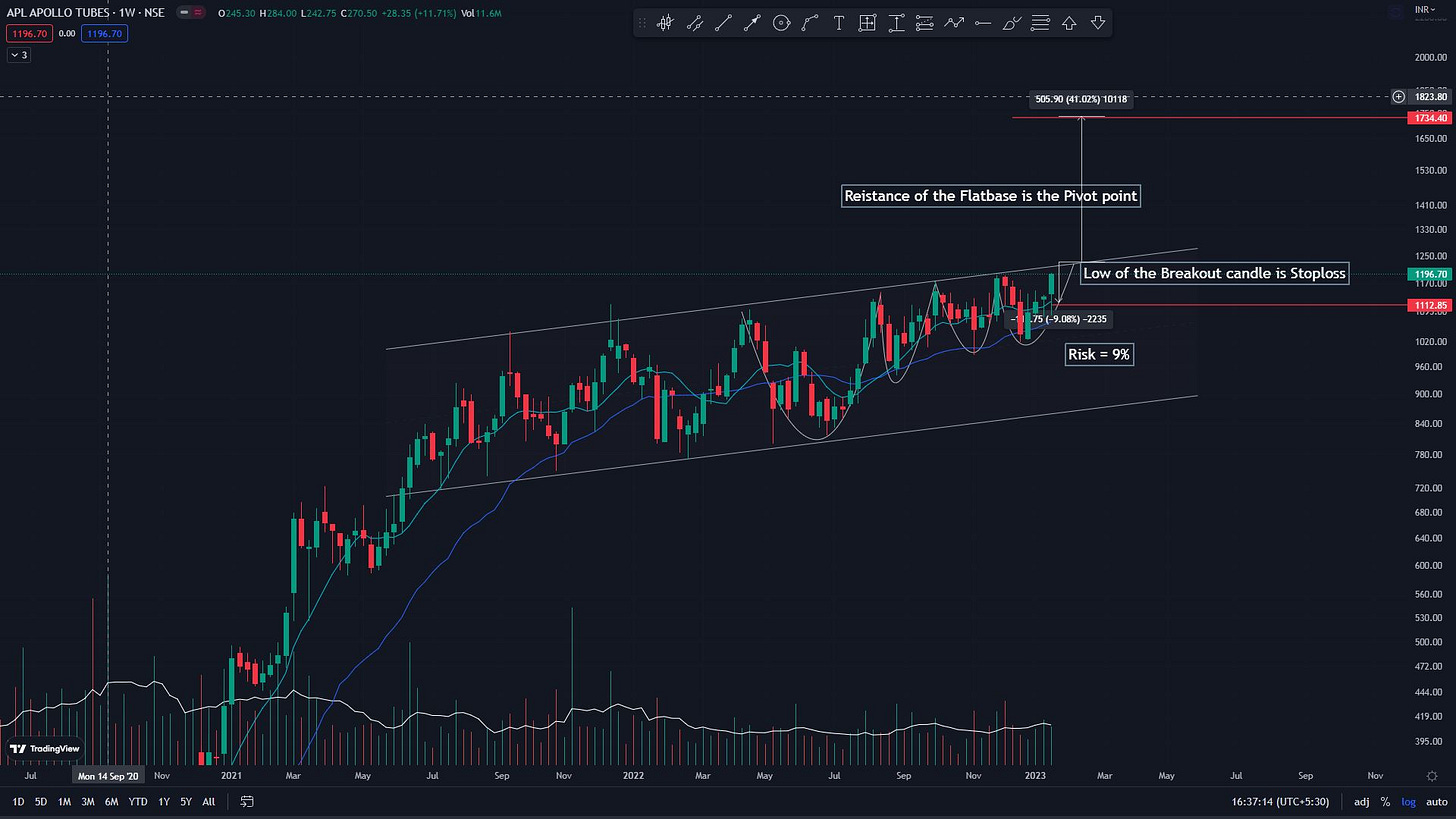
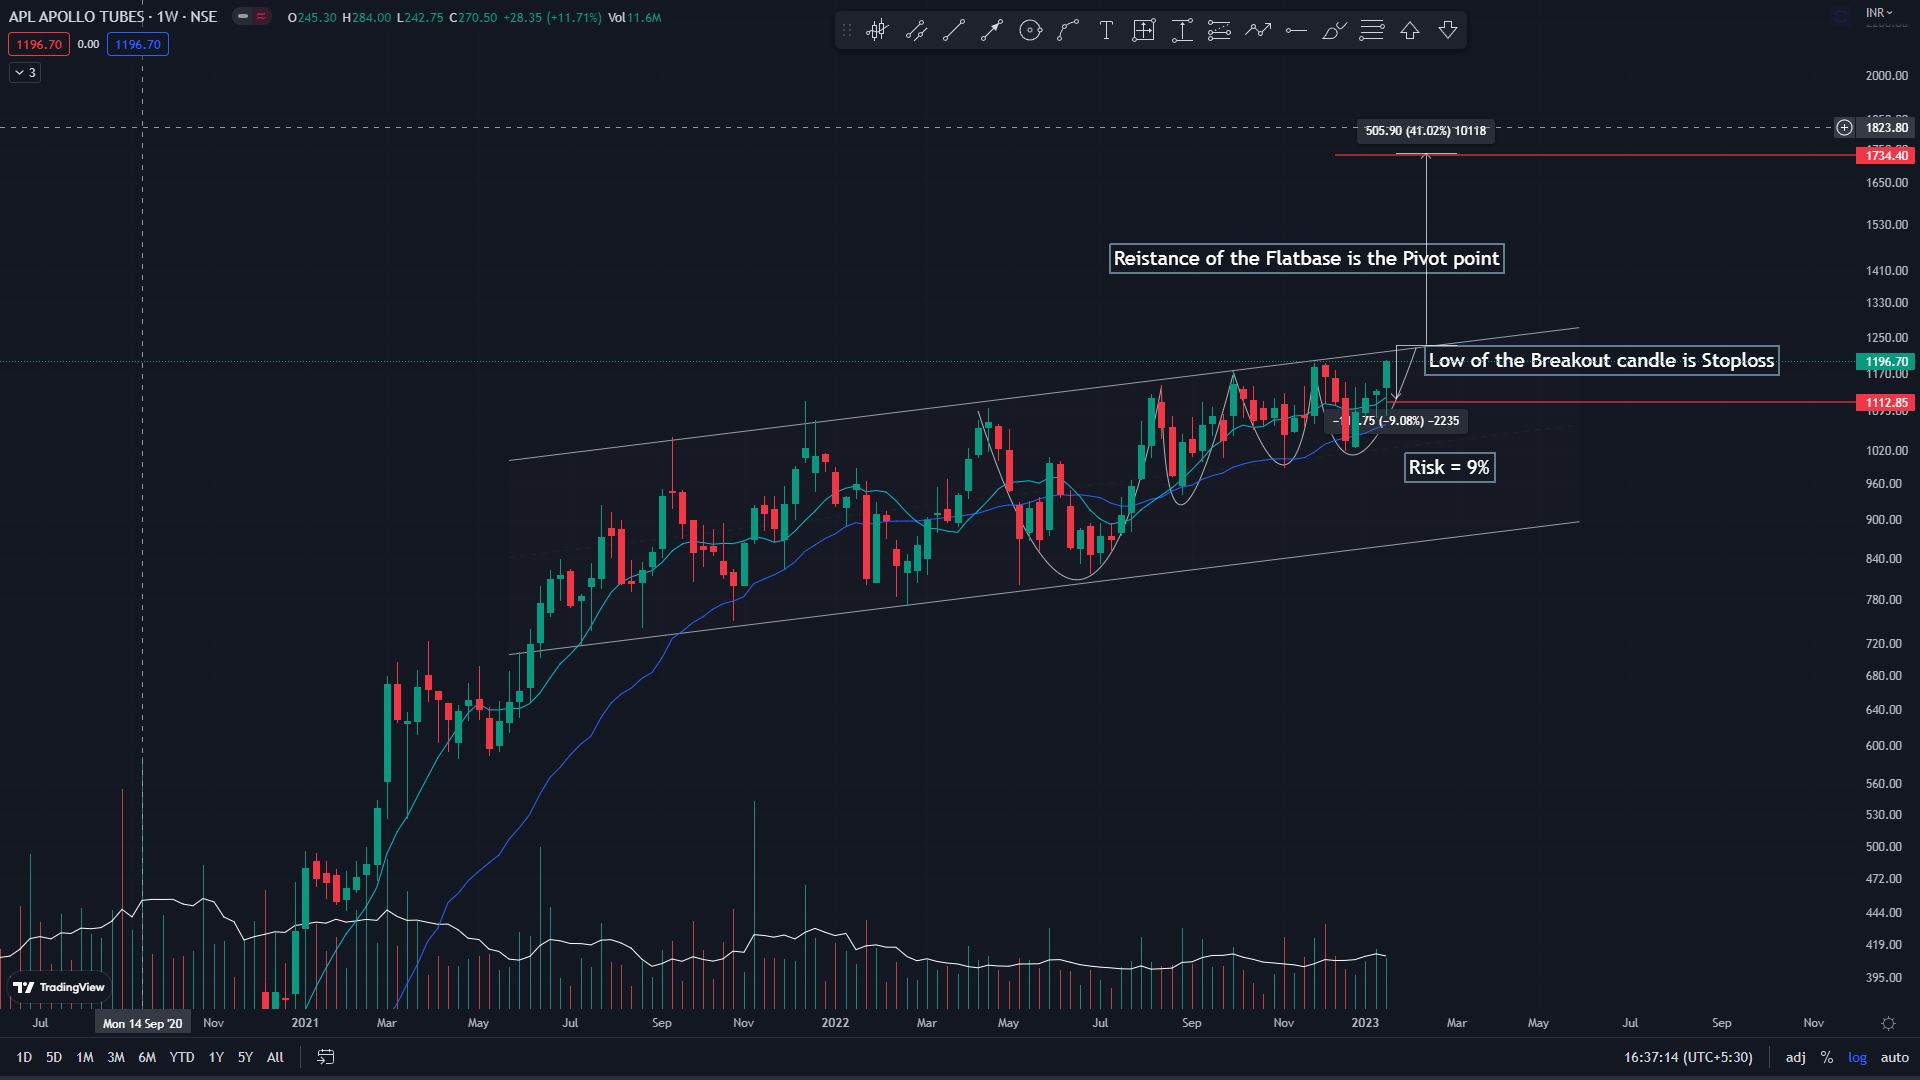
Let’s understand this by taking an example of a breakout setup right now in the market.
Here is Aplapollo inside a Flatbase (with a small +ve slope) with a VCP pattern.
The resistance of the flat base is the pivot point.
The low of the breakout candle (when that occurs, which hasn’t occurred yet in this case) will be the ideal stop loss.
This gives you the lowest possible risk of about 9%.
Side note: Stop loss placement is part science part art. Read more on this Twitter thread
The highest reward/risk ratio:
Now that we know the amount of risk the trade carries, we next need to calculate the maximum possible reward for the trade as well. There are various tools that can project a plausible target for a setup, eg. Fibonacci retracements and classical chart pattern target rules (something for another article).
For a trade accuracy of 50% (1 successful in every two trades), you will have to achieve at least 1X of your risk at the minimum to break even. The point is, your estimated reward should be as high a multiple of your risk. The actual reward/risk ratio is an important metric that defines the success of your trading career.
Canslim traders (they are generally swing/positional) generally aim for a ratio of >3:1. This ratio tends to be lower for day traders (around 1:1) and higher for long-term investors (>10:1).
In our previous example, the pattern target of the Flatbase comes to about 41% (breadth of the channel/base). This gives us a max reward/risk ratio of 4.5:1.
So you risk 1 rupee to make 4.5 rupees.
Looks like a good bet to me.
The minimum opportunity cost:
This point is a little counterintuitive. But hear me out.
Opportunity cost basically means the loss of other alternatives when one alternative is chosen. So once you put your capital on Stock A and it doesn't move for a week, that is a lost opportunity to make money on stock B which has moved 20% in the same week. I wanna invoke the great Einstein here who not only said Time is space but also Time is money. Hence, the timing of the trade becomes extremely important as, the greater the time spent holding a nonperforming trade, the greater the risk.
If you are a day or a swing trader, by default this opportunity cost is low. As a swing trader, I generally don’t hold a trade that doesn’t work for more than a week or two (that is just the cut-off I use).
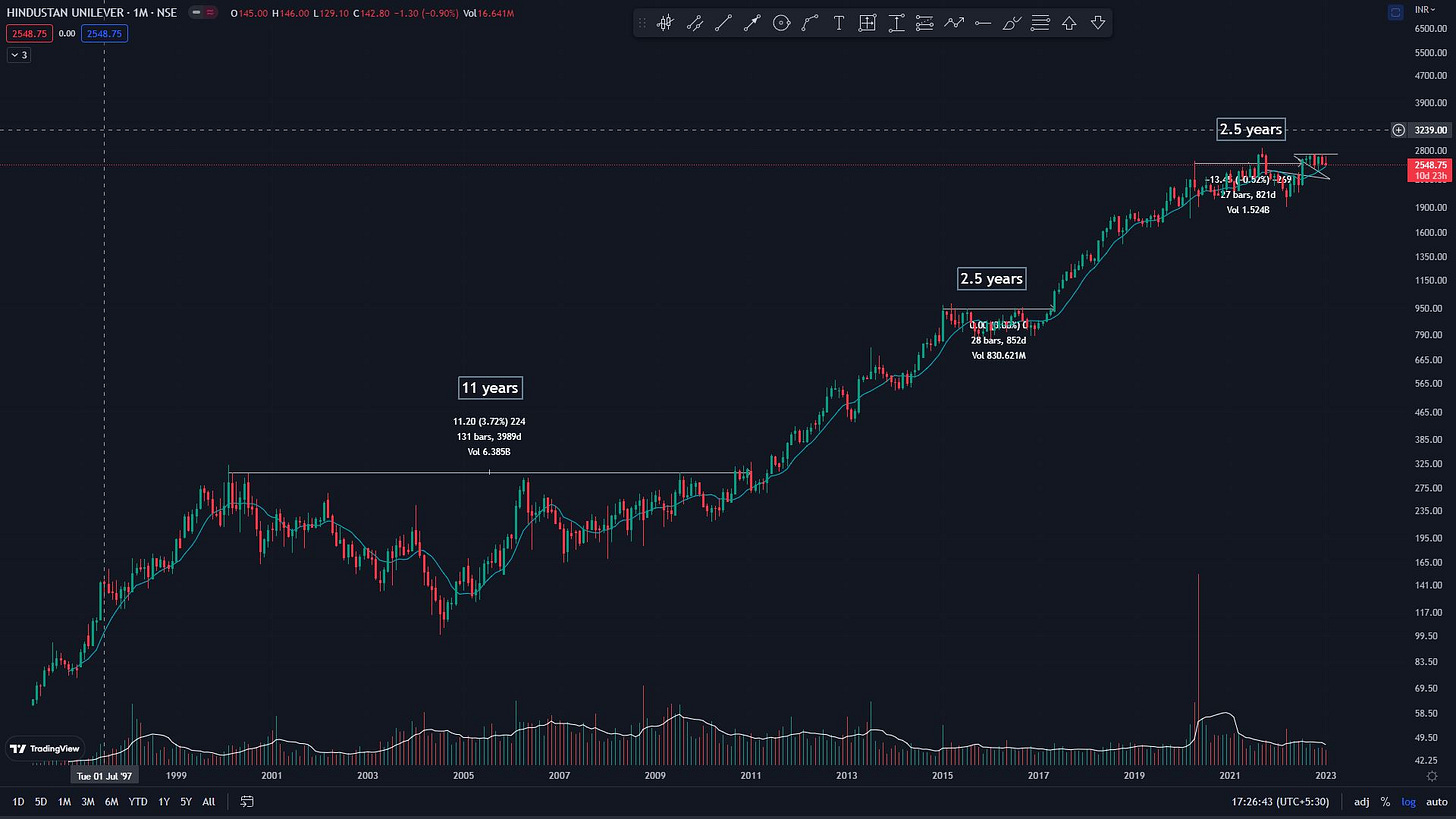
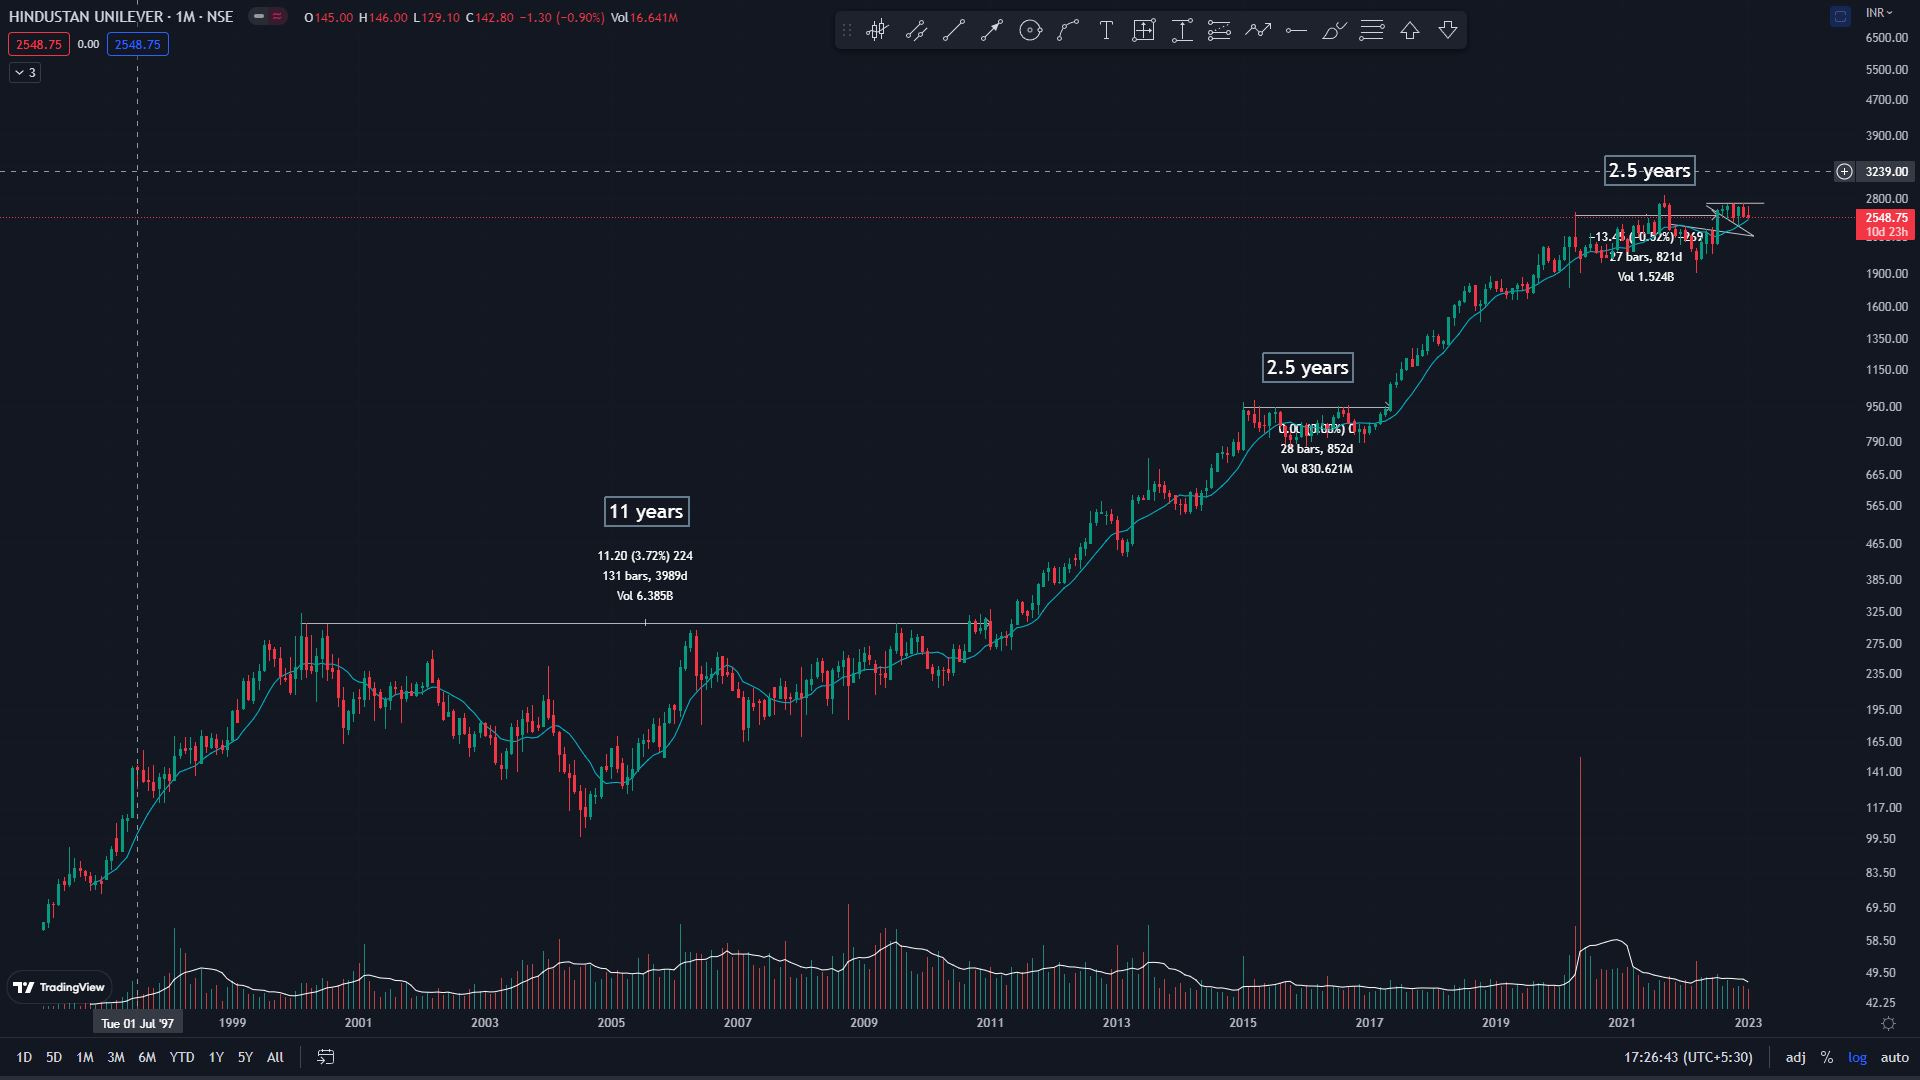
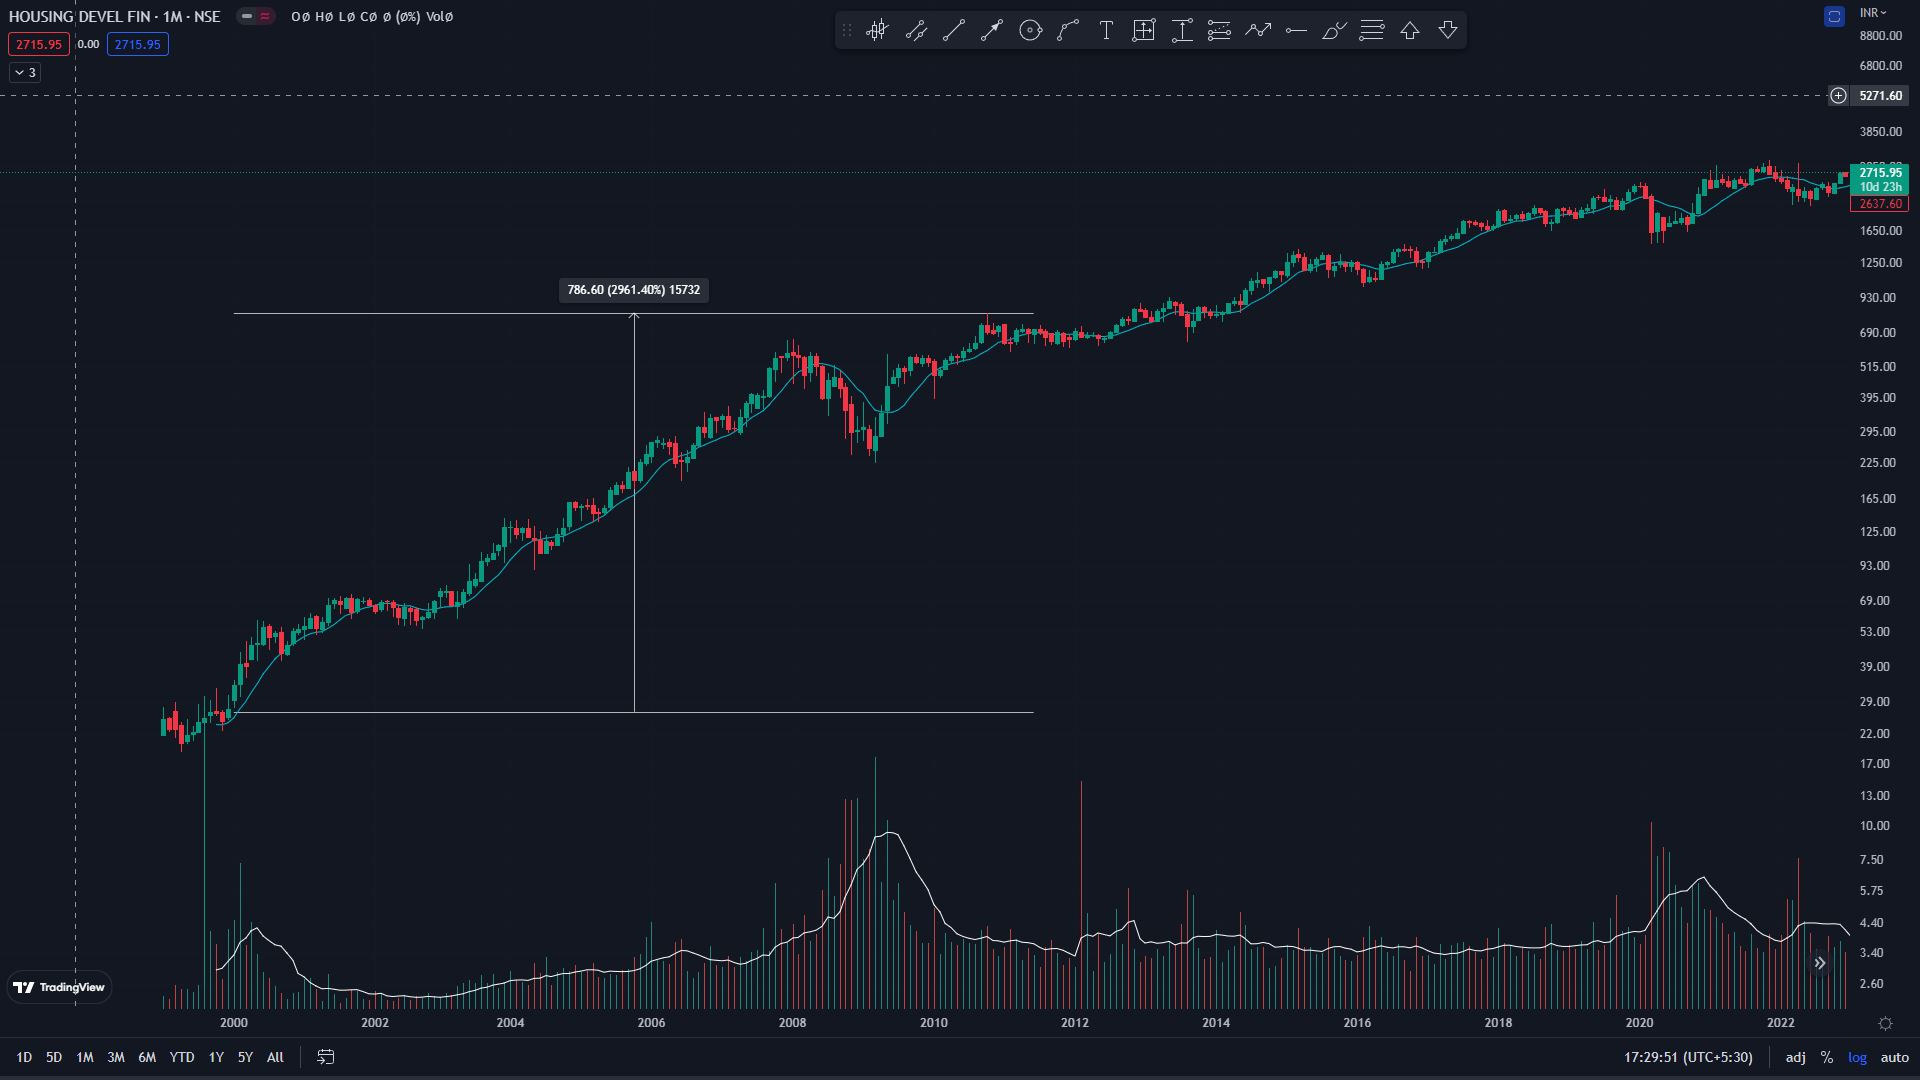
Timing a trade becomes more important as your timeframe increases. Imagine buying the FMCG giant Hindustan Unilever in the year 2000 and sitting through an 11-year run with absolutely 0 return to show for it. On the other hand, holding HDFC during the same period would have fetched you a whooping return of 3000%.

By now, I hope I have convinced you that timing a trade has absolutely everything to do with “the perfect entry point”.
This would be then, a perfect time to introduce the readers to the concept of stage analysis (a more detailed article on this soon). Here is my Twitter thread on the same below:

In Short, like everything in life and nature, stocks also go through a cycle of uptrend and downtrend punctuated by a basing phase in between.
This cycle is also fractal, meaning that it occurs in all timeframes.
Stage 2 is the markup or the uptrend phase.
Now, logic entails that the perfect entry would therefore be at the beginning of a stage 2 cycle.
Let’s look at this using a live example in the market, where a stock might be transitioning from stage 1 to stage 2.
Atul Auto: Monthly
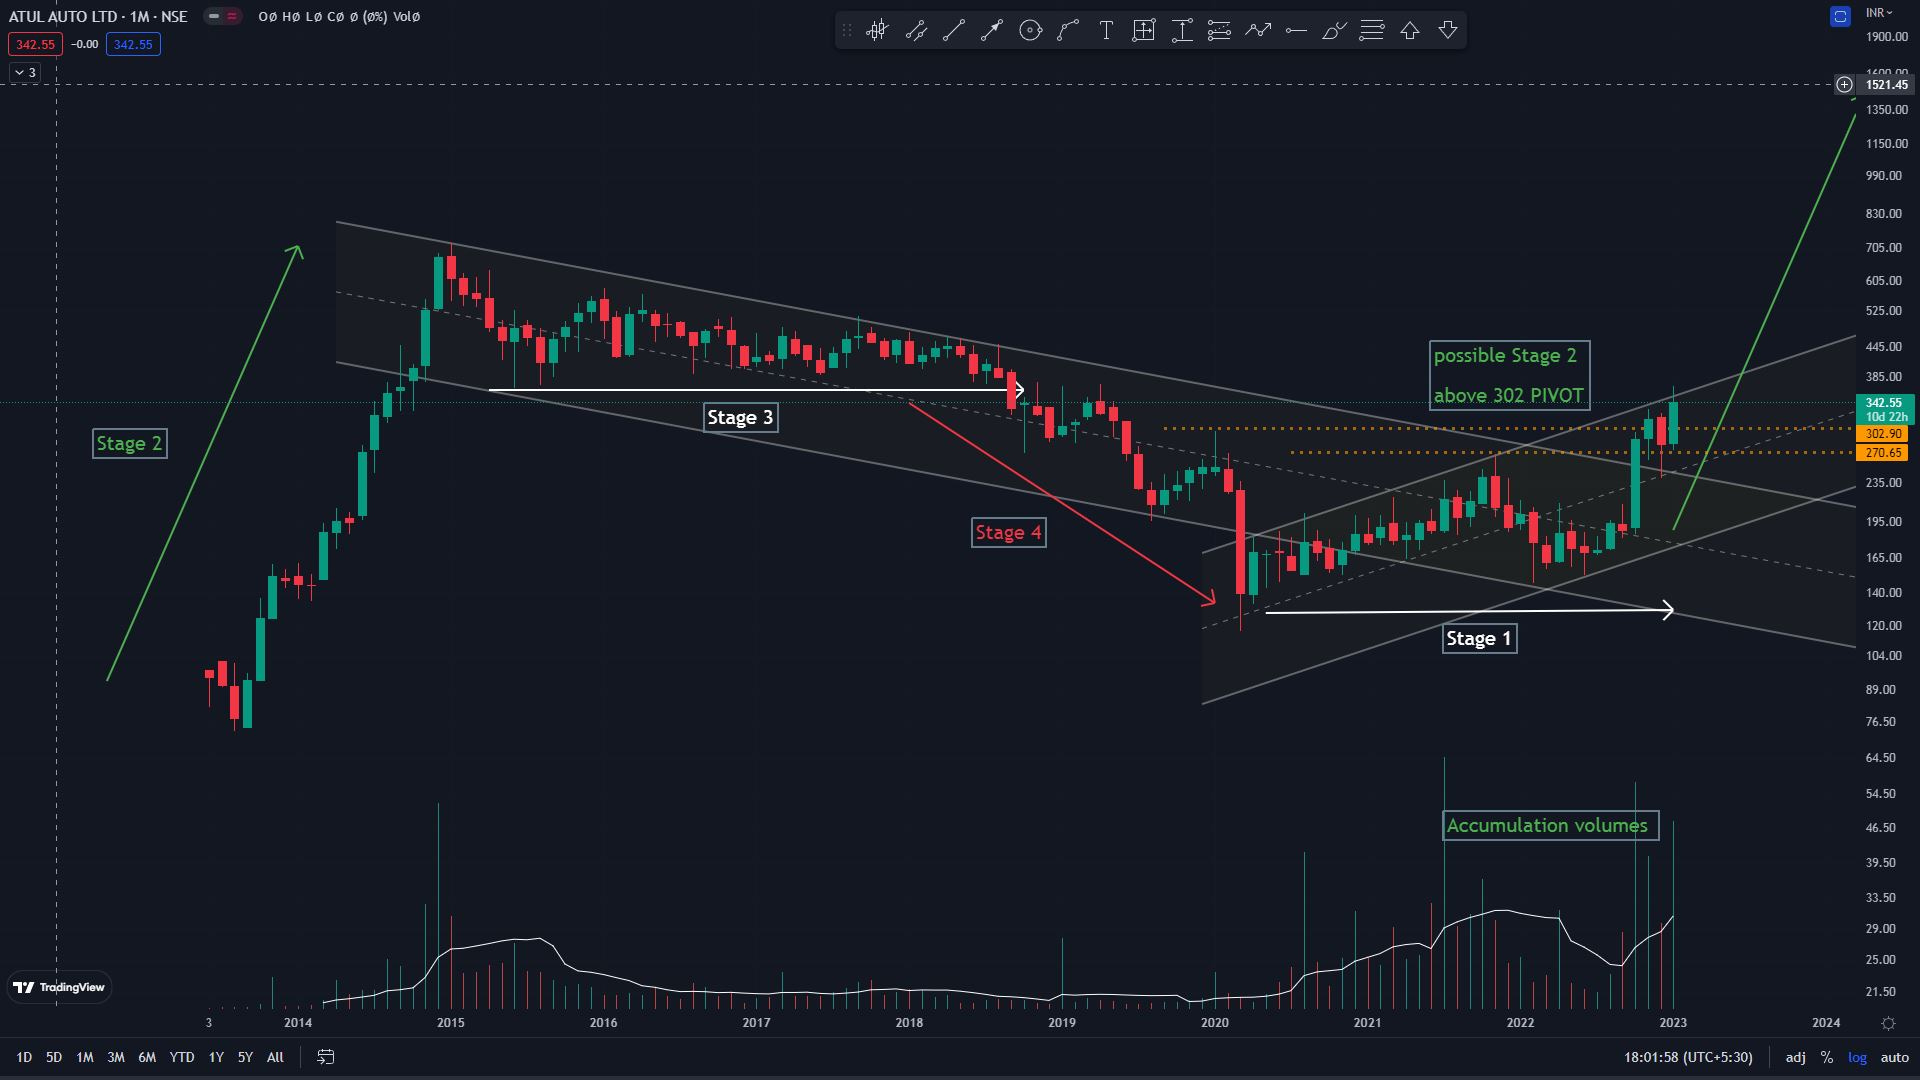
The Breakout of the previous swing high around 302 marks a new high which is a higher high. The stock has already made a higher low at 152, hence the higher high marks the beginning of a POTENTIAL Stage 2 uptrend.
A great question that you might have at this point is to ask, why not then buy around 150 and already be at a 100% gain by now?
This is classic Hindsight bias. Remember Hindustan Unilever.
The answer is, we wouldn’t have known how long the price would have taken to make this higher high. Fortunately, It spent only 2.5 years in the stage 1 base, unlike the previous example of Hindustan Unilever which had an 11-year barren spell.
But there is a Trade off:
The closer you get to the Pivot (perfect entry point), there is a chance that you are moving to the other side of the price where “probability of failure” increases.
But further away you get from that point, you move away from the low-risk entry point.
You give up low-risk for more confirmation, i.e you take a faster decision for a better risk. That is the tradeoff.
For eg:
Nifty50 is at/around the 21-ema, a high probability area for a bounce.
The more we wait to get the price to 21 to entry, we risk ourselves of a breakdown.
The more we wait for the price to bounce, our risk (Stoploss) increases as the most valid SL would be the 21-ema.

To recap: The perfect entry point
Is a price point that provides the lowest possible risk, the highest reward/risk ratio, and the minimum opportunity cost.
Is slightly different for traders and investors as it depends on your trading timeframe.
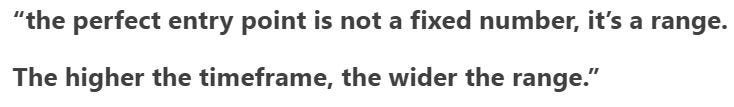
Is not a fixed number but a range. The higher the timeframe, the wider the range.
Can be achieved by timing the beginning of a stage 2 cycle (for positional traders)
There is a trade-off between low-risk and confirmation (Hit-rate/batting average).
That’s all for this week. I thoroughly enjoyed writing this and I hope you enjoyed it as much.
If you are a beginner looking to SIMPLIFY your trading.
I conduct my Annual Beginners Trading Masterclass once a year (around July).
Announcements for the 2025 Masterclass will be coming soon.
Last year, it was all about Trading Systems.
If you find my articles valuable, you will find the Masterclass 100 times more useful.
You can now take advantage of the recorded session.
Details of the masterclass are below.
Trading System Masterclass for Beginners
·
July 12, 2024

The Annual Sakatas Homma’s Beginners Trading Masterclass is finally here. This year, it will be all about the trading system. Your unique trading system. Excited! would be an understatement. Details Below.
That's all for today.
I also help traders build their trading systems and show mine daily in HPA (Homma Private Access).
(PS: 1-month free HPA access is complementary with the Masterclass)
Details below:
Homma Private Access membership:
HPA is a subscription-based educational service (on WhatsApp). Benefits include:
Daily Market Breadth, Momentum, Sector Rotation, and Relative StrengthUpdate.
Access to all my proprietary scanner toolkits, including the BBB (buy before breakouts) scanner and the Homma Khela Hobe 2.0 scanner.
Access to my proprietary Breadth-Momentum-Relative Strength & Sector Rotation dashboards.
Access to my Trading View indicators: Mswing indicator, Homma Khela Hobe, Buy before Breakouts (BBB), etc.
HPA Weekly: Hourly weekend deep dives and Q&A.
1-year access to The Technical Take premium.
Access to the daily Ranked Mswing Relative Strength Top 100 watchlist.
Yearly membership of 15000/- INR only.
UPI payment & WhatsApp @9481506784
Yours
Sakatas Homma.
Very much informative. Easy to understand with good examples.Thanks for sharing it. Keep posting!!