The Homma Triple B setup
Buy Before Breakouts
My Aspiring Peak Trader,
I have been working on a setup that allows me to buy a breakout, before the obvious buy point.
I wrote a scanner for exactly what I am looking at before I buy. I call the scanner my Homma Triple B scanner. In this article, I will explain to you:
The logic and the conditions behind the setup.
The entry time
Stoploss and risk
What am I looking for in a Homma Triple B?
So,
I am looking for a stock that is already in momentum and has made a quick move of at least 20% during the last quarter.
The stock is now consolidating and has pulled back from the top of the rally for not more than 10% in the last 2 weeks. The pullback has to be orderly (what’s an orderly pullback? Topic for another article) and should be manually checked on each hit.
The stock has found support at one or both of my favorite short-term moving averages, i.e. 10sma and 21ema, and therefore closed around the 10/21 ma.
Close is not more than 2% below the 10/21 ma.
The low has undercut either the 10sma or the 21ema at least once in the last 5 days. This is for a shakeout vibe.
Only pulling back isn’t enough for the stock to shine in Homma Triple B, it also has to be tight for the last 5 days. How tight? The (highest open- lowest close) should be within 5% of the highest open.
Another general condition for an uptrend is included viz: close above 50-day sma and 200-day sma.
Close should be at least 20% above the 52-week low and within at least 75% of the 52-week high.
Volumes: 1 day ago sma volume (5 periods) should be lower than 5 days ago sma volume (20 periods). Basically, the volume should dry up and this should be also checked manually on the hits.
Now, what’s the trigger?
The trigger is a CCI indicator-based trigger which tells me that the upward momentum is back.
CCI(20) is higher than yesterday which was lower than the day before.
On the day of the trigger, the daily move should be less than 5% (and greater than -3.5%). The lesser the better. This is to ensure that the move has only started and that the bulk of the move may be waiting to come soon.
This also will give us a smaller stop loss, hence a smaller risk.
Entry Time:
The setup is designed to take catch the start of a possible momentum burst, hence an entry can be made as soon as the stock hits the scanner, or after 3.20 pm just before the day’s close.
Sometimes, the stock hits the scanner in the morning and by the end of the day, it disappears. This happens when the stock has moved during the day after hitting the scan at the start of the day.
Stoploss:
Below the shakeout low, below the previous day's low, below the day’s low, or below the 21-day ema low. Whichever is the lowest.
Whatever it is, the total risk on your portfolio should be less than 1% (0.5% is even better).
Exits:
As this is a swing set up. Booking partially (50%) at 3 times the risk is advised. Rest trail with your favorite MA (21 ema works well) or trail with the Supertrend (10/3).
Have I backtested this setup?
I have done a minimal manual backtest on select stocks and select days. Not sufficient to claim that this is a peak setup yet.
I am still looking for a way to comprehensively backtest this. I will update you when I do that.
I am sharing yesterday's (Friday’s) results here for you to run a manual backtest.
Ideally, the mean return of the hits should be higher than the benchmark index Nifty 500 for whatever timeframe you are comparing (1 day, 1 week, and so on).
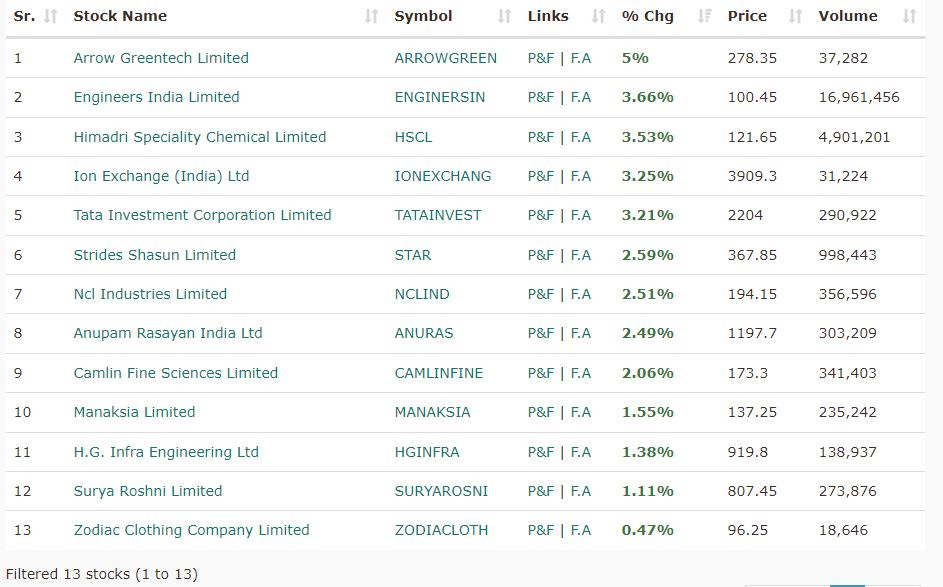
Friday 19th May post 3.30 pm hits: (You can directly copy and paste this on a Tradingview watchlist and monitor the whole week.)
ARROWGREEN, ENGINERSIN, HSCL, IONEXCHANG, TATAINVEST, STAR, NCLIND, ANURAS, CAMLINFINE, MANAKSIA, HGINFRA, SURYAROSNI, ZODIACLOTH,
Friday 19th May post 9.20 am hits:
ANURAS,
CAMLINFINE,
KEI,
IONEXCHANG,
These were the hits at 9.20 am.
You will notice that KEI is not included on the 3.30 pm list. Why?
because, after it hit the scanner, it made a >5% move and hence evaded the scan at the end of the day.
Sakatas Homma exists to share all and any trading-related information and data with any beginner who wants to learn how to trade for free. Furthermore,
If you are a beginner trader struggling to be consistently profitable.
Sakatas Homma can help you level up in the following 2 ways below:
The Sakatas Homma TA masterclass for beginners:
A monster course (12-15 hours total). Hourly sessions on weekends. Twice a year.
Please register for the fall 2023 course (September 2023) using the link below.
https://docs.google.com/forms/d/e/1FAIpQLScfnQA1w9WDTtTAPEHIqzkS9jhRSZFA1BZXuWRZ5JPZ3Qfu8g/viewform
Watch my 1st session of the spring 2023 batch.
Homma Private Access membership:
HPA is a subscription-based educational service (on WhatsApp). Benefits include:
Daily Market Breadth Update.
Access to my scanners and dashboards and charting layouts.
Weekend hourly session and Q&A.
Live updates on my portfolio and the trading setup rationale.
Live updates of key setups I am tracking.
Yearly membership of 6000/- INR only (this price is for the Founding batch and will apply till September 2023)
UPI payment & WhatsApp @ 9481506784.
This is all for this weekend,
I will see you in the next one. Till then,
Don’t stop asking those stupid questions.
~ Homma
Some Peak Scanners for you:
Pullback to 10/21 ma: https://chartink.com/screener/copy-shpb1021
VCP (long-term timeframe): https://chartink.com/screener/shvcp-epic-modified
sector rotation/ Relative strength dashboard:
https://chartink.com/dashboard/177929


