
The Mswing Indicator
A Trader's Ultimate Toolkit for Momentum, Breadth, and Relative Strength.


Introduction
Finding tools that cut through noise and deliver actionable insights is rare in the chaotic trading world.
The Mswing (Momentum for Swing) Indicator, a versatile, multi-functional tool, simplifies the complex world of trading by combining momentum analysis, market breadth, and relative strength into one robust framework.
Whether you are a swing trader, long-term investor, or market analyst, the M Swing offers a systematic way to stay on the right side of trends, relieving you from the stress of navigating the market complexities.
Let us break down why this indicator deserves a spot in your toolkit.
Watch the Explainer YouTube video here.
What is the Mswing Indicator?
The Mswing is a momentum oscillator that calculates the rate of price change over 20 and 50 periods (days/weeks). Unlike traditional momentum tools, it goes beyond mere direction—it quantifies strength (Market Momentum), compares assets to benchmarks (Relative Strength), and even gauges market-wide sentiment (Market Breadth).
It can also help in your entries and exits.

Quantifying Momentum Strength
The M Swing's relationship with its EMA (e.g., 5-period or 9-period) adds nuance to momentum analysis:
M Swing >0 and Above EMA: Momentum is positive and accelerating (ideal for entries).
M Swing >0 and Below EMA: Momentum is positive but decelerating (caution).
M Swing <0 and Above EMA: Momentum is negative but improving (watch for bullish reversals).
M Swing <0 and Below EMA: Momentum is negative and worsening (exit or avoid).

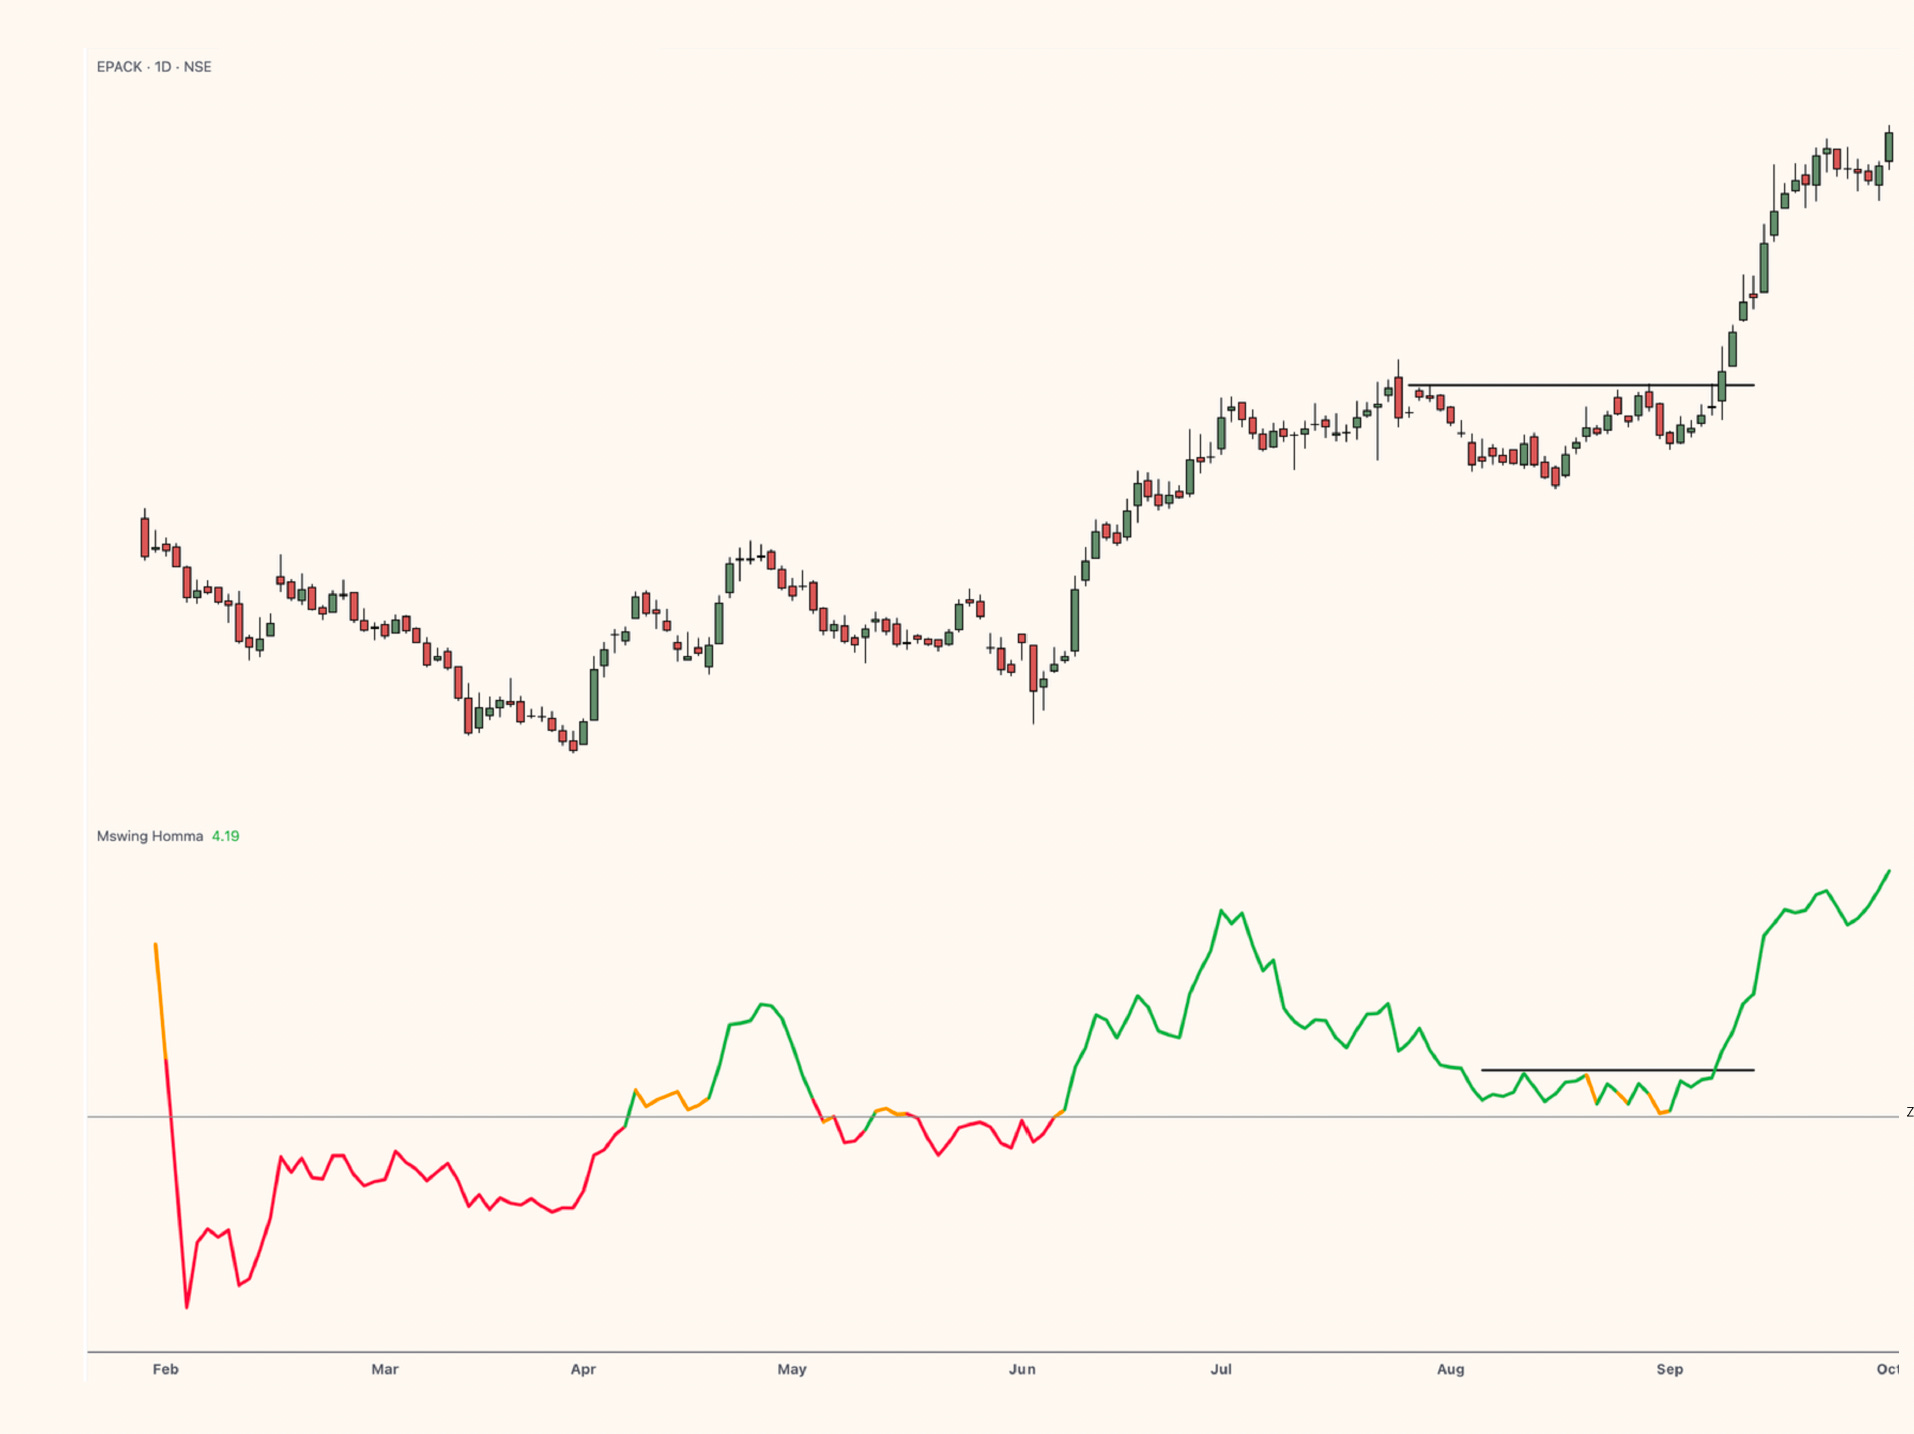
Example:
When the Mswing of EPAC (chart below) crossed above its EMA and remained green, it indicated a strong uptrend, resulting in a 45% rally.
Relative Strength Scanning (M Score)
Sort stocks by their M Swing score to identify leaders and laggards:
Top Quartile: High-momentum stocks (e.g., Indowind Energy, Alumunium Ltd.).
Bottom Quartile: Weak stocks to avoid/short (e.g., defense sector stocks in mid-2023).
Why It Works: Stocks with strong Mswing scores tend to outperform during bullish phases, while weak ones collapse faster in downtrends.
You can perform the sorting on Tradingview.
(For non-premium Tradingview users, this sorting can be done in chartink as well)

Entry and Exit Signals
Entry: Buy when Mswing:
crosses above 0. Or,
is above 0 and crosses its EMA or, breaks out of a tight range.


Exit: Sell on:
Strength: Mswing >4 (overbought).
Weakness: Mswing <0 (usually coincides with price below 50-day SMA).


Examples:


Combining M Swing with Price Action
Breakouts: Use Mswing >0 to confirm valid breakouts (e.g., EPACK's base breakout).
Pullbacks: Buy dips when Mswing holds above EMA during retracements.
Sector Rotation:
As a swing trader,
Compare the Mswing scores of indices/sectors to rotate capital to the strong groups (e.g., renewables vs. traditional energy).
Multi-Timeframe Analysis
Daily: For swing trades.
Weekly: For trend confirmation.
Monthly: For long-term portfolio adjustments.
Market Breadth Analysis
The Homma Mswing Score tracks the percentage of stocks in a universe (e.g., NSE 500) with Mswing >0.
>80%: Overheated market (profit-taking zone).
<20%: Oversold market (buying opportunity).
Real-World Insight: In March 2023, the Mswing breadth plunged below 20%, foreshadowing a sharp rebound in Indian equities. Conversely, the January 2024 M Score spike above 80% warned of an impending correction.
(For positional and long-term timing, Mswing weekly plots can be used to get similar insight.)

How to Get Started
Access the Tool:
TradingView Script (free community version).
Track the Breadth:
Chartink Homma Mswing Score breadth dashboard for real-time market breadth.
Join the Community:
Discuss strategies in our HPA community. (Get access to additional tools too)
Conclusion
The M Swing Indicator isn’t just another tool but a complete trading system in disguise. Quantifying momentum, flagging extremes, and spotlighting relative strength empowers traders to make data-driven decisions in any market regime.
Whether you are hunting for breakout stocks, rotating sectors, or managing risk, the M Swing provides clarity in chaos.
Cheers and Best
Nitin (& Homma)
 | A guest post by
|
Your contributions are highly valued and greatly appreciated by our trading community. Thank you for your dedicated efforts.
What is "close[20]" and "close[50]" in the formula?