Everything in the market is cyclical.
And so is momentum.
As a swing trader, a great way to time the market is to time your entries and exits in line with the market momentum.
In this article, I will explain:
What is Market Momentum?
How do we measure it?
Trend vs Momentum.
How to read the Momentum data w.r.t timing the market.
This video discusses timing the market momentum in detail.
What is Momentum and how do we measure it?
Momentum is the rate at which the price is changing.
price change % = {close price today - close price (x days ago)}*100/ close price (x days ago)
Rate of price change = {close price today - close price (x days ago)}*100/ close price (x days ago)/X
The higher this number for a stock, the higher its momentum.
Notice that you need a timeframe to calculate momentum.
For the short-term (swing trading), I use 10 or 20 days.
For the medium-term (positional trading), I prefer 50 days.
So you can plot momentum for all and any timeframes.
But how do we plot the market’s momentum?
Simple.
Plot the average momentum of all NSE stocks (in the timeframe of your choice).
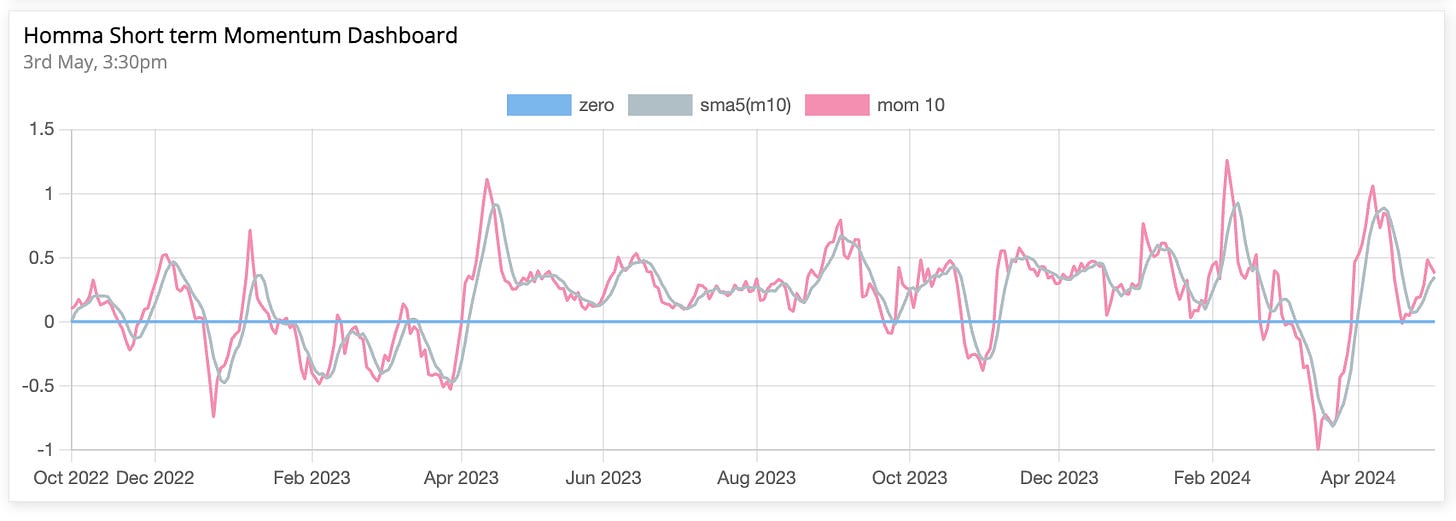
See the 10-day and 50-day momentum plotted below:
Cool.
So now that you know how to plot Mr. Market’s Momentum, I will show you how to interpret the data concerning timing the market.
But before that, let’s clear this simple & annoying confusion first.
Trend vs Momentum:
Most traders seem to be confused with Trend vs Momentum.
The trend is about price direction while momentum is about the intensity of the price in that direction.
Imagine you and your friend are traveling from Bengaluru to Goa. You are on a Honda Activa while your friend is on a bicycle. You both leave simultaneously and after 5 hours have traveled 300 and 25 km respectively.
You both are on an uptrend (in a 5-hour timeframe).
But your momentum (rate of change) is way higher than your friend’s.
Clear?
Reading the Momentum data and timing the market:
I will take the example of short-term momentum here. For this, I am using the 10-day momentum plot.
Here is how you read the data:
Above 0; bullish bias.
Above 0 and rising; very bullish bias.
Above 0.8/1.0; overbought and prone to a pullback.
The 5-sma cross below is a confirmation of pullback/correction.
Below -0.8/-1.0; oversold and likely to bounce.
The 5-sma cross above is a confirmation of the bounce.
The best time for “risk-on” mode would be at the bounce from the oversold zone.
or, while crossing above 0.
or, a bullish divergence with price.
The best time for the “risk-off” mode would be at the rejection from the overbought zone.
or, while crossing below 0.
or, a bearish divergence with price.
That’s all for today mate.
Here is the link to the Homma Momentum Dashboard for TTT.
Today I showed you one of the simplest ways to visualize momentum. And use it to your advantage.
Understanding the absolute basics of Trend, momentum, and cyclicality in various market regimes is key to consistency & long-term trading success.
The next step would be knowing yourself (your timeframe and risk tolerance) and then developing a TRADING SYSTEM that is personal and unique to YOU.
I show my process and system day in and day out.
And guide the Homma Private Access (HPA) members to build their own.
HPA has been the shortest way towards being consistently profitable for more than 200 traders/investors.
There are 2 ways I can help you:
Join the Sakatas Homma TA masterclass for beginners:
A complete course containing 8 Hourly sessions. Once a year.
To register for the next live masterclass, please fill out this form.
Watch the 1st session of the Autumn 2023 masterclass.
To access the full 8 sessions, contact us via WhatsApp @ 9481506784
Homma Private Access membership:
HPA is a subscription-based educational service (on WhatsApp). Benefits include:
Daily Market Breadth, Momentum, Sector Rotation, and Relative Strength Update.
Access to all my scanners including the BBB (buy before breakouts) scanner, and the Homma Khela Hobe 2.0 scanner.
Access to my proprietary Breadth-Momentum-Relative Strength & Sector Rotation dashboards.
Access to my Trading view indicators: Homma Khela Hobe, Buy before Breakouts (BBB), Homma Endgame, etc.
Access to live Telegram alerts to Homma Khela Hobe, Homma Pullback, and TGP scanners.
HPA Weekly: Hourly weekend deep dives and Q&A.
1-year access to The Technical Take premium.
Live alerts to high-risk-reward setups breaking out.
Live updates on my portfolio and the trading setup rationale.
Access to my high probability watchlist.
Yearly membership of 15000/- INR only.
UPI payment & WhatsApp @ 9481506784.
Yours
Sakatas “systems” Homma.


Great read! Thanks for sharing :)
How can we build a Homma Indicator for trading view ?