
What Really is a VCP pattern?
& why you should look for it everywhere?

Progress over Perfection. Always
My dear Peak Aspiring Trader
Today I wanted to talk to you about VCP. Short for Volatility Contraction Pattern.
What is a VCP?
What are the characteristics of a VCP?
How many contractions can occur?
What comes after the contraction?
In which timeframe does VCP occur?
Some PEAK examples.
What is a VCP?
Volatility contraction pattern is a term coined by the GOAT, Mark Minervini.
It is not a solid geometric chart pattern, but a characteristic of a constructive base (ie a consolidation).
Its is a movie that shows Demand winning over Supply one contraction/Pullback at a time.
Volatility: the price swing from a pivot high to a pivot low measured in terms of percentage.
Contraction: meaning decrease.
So, VCP is a characteristic in which there is a decrease in the price swing from a pivot high to a pivot low, aka pullback (measured in terms of percentage) inside a base from left to right.
This characteristic appears in many chart patterns viz. symmetrical triangle, an ascending triangle, a descending triangle, the mast of a flag, and many other places.
Let’s look at the characteristics in more detail.
A perfect VCP has these 5 salient characteristics.
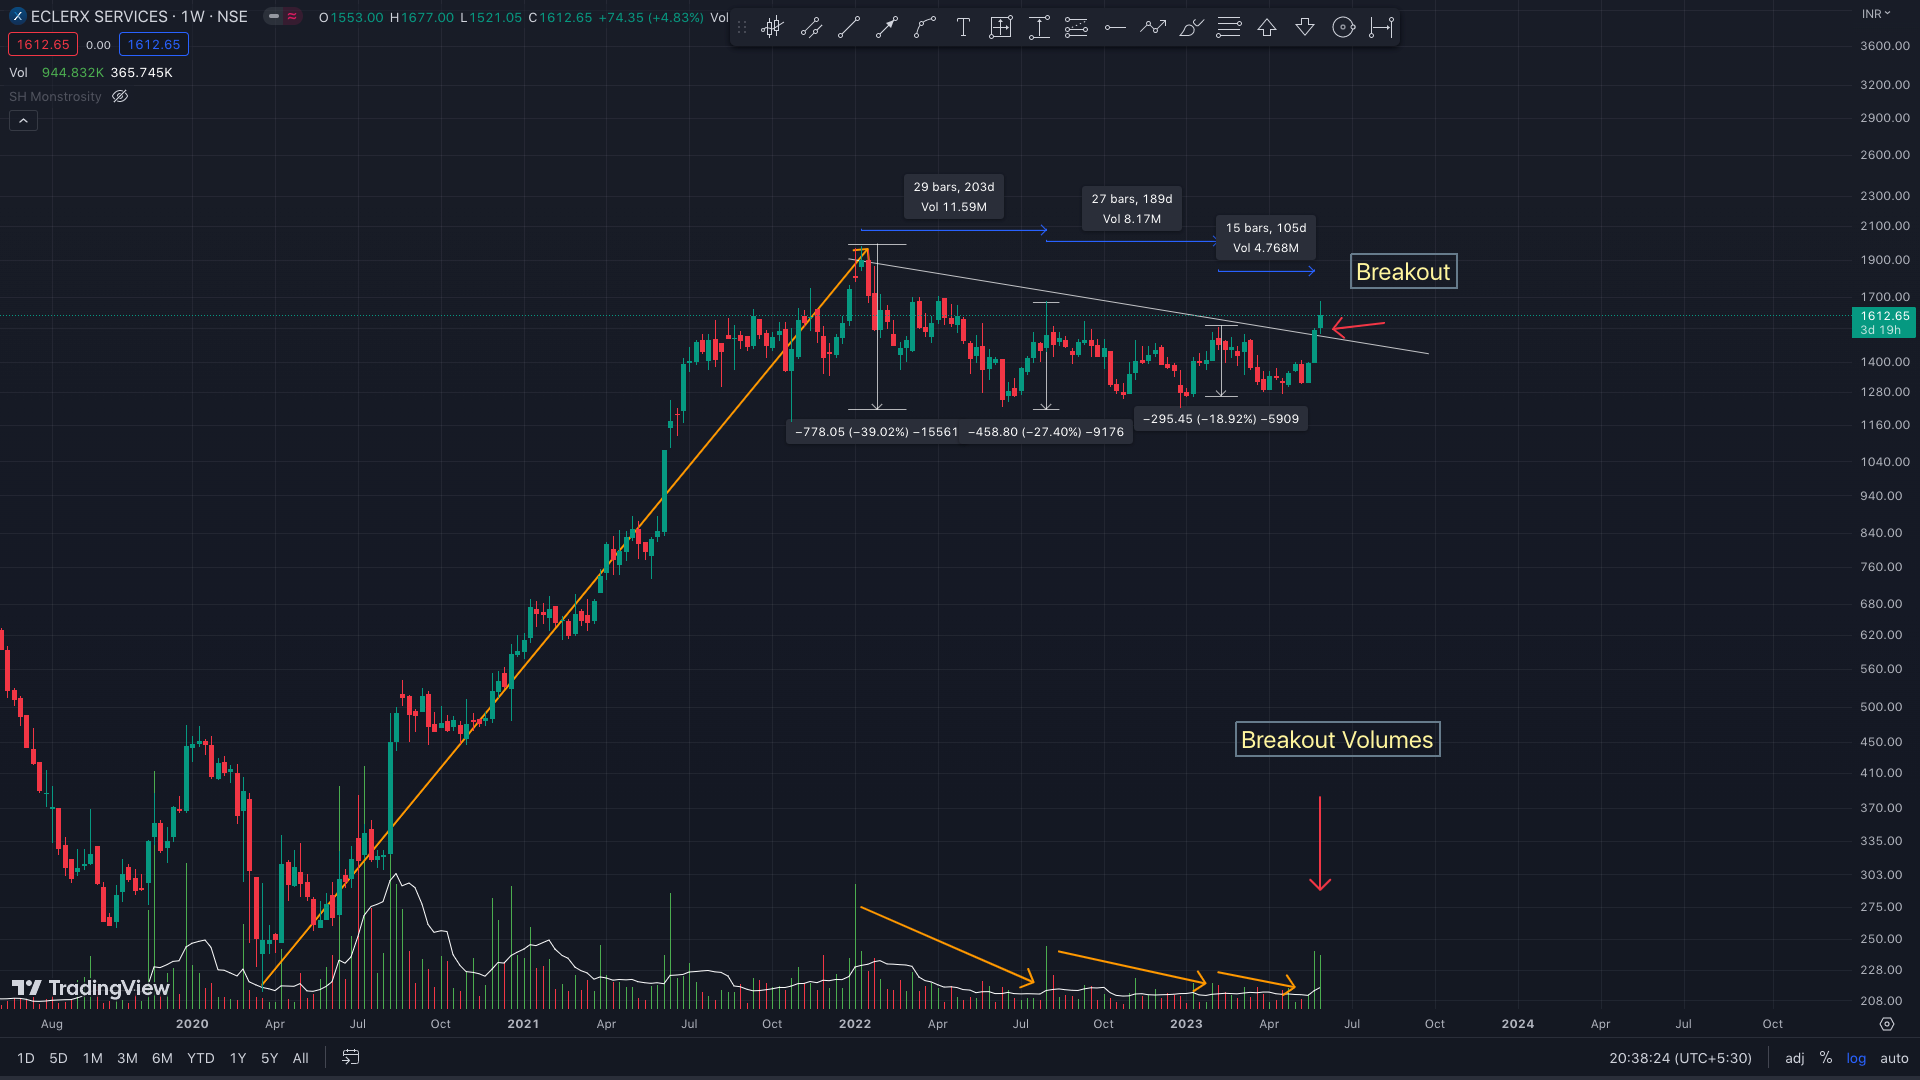
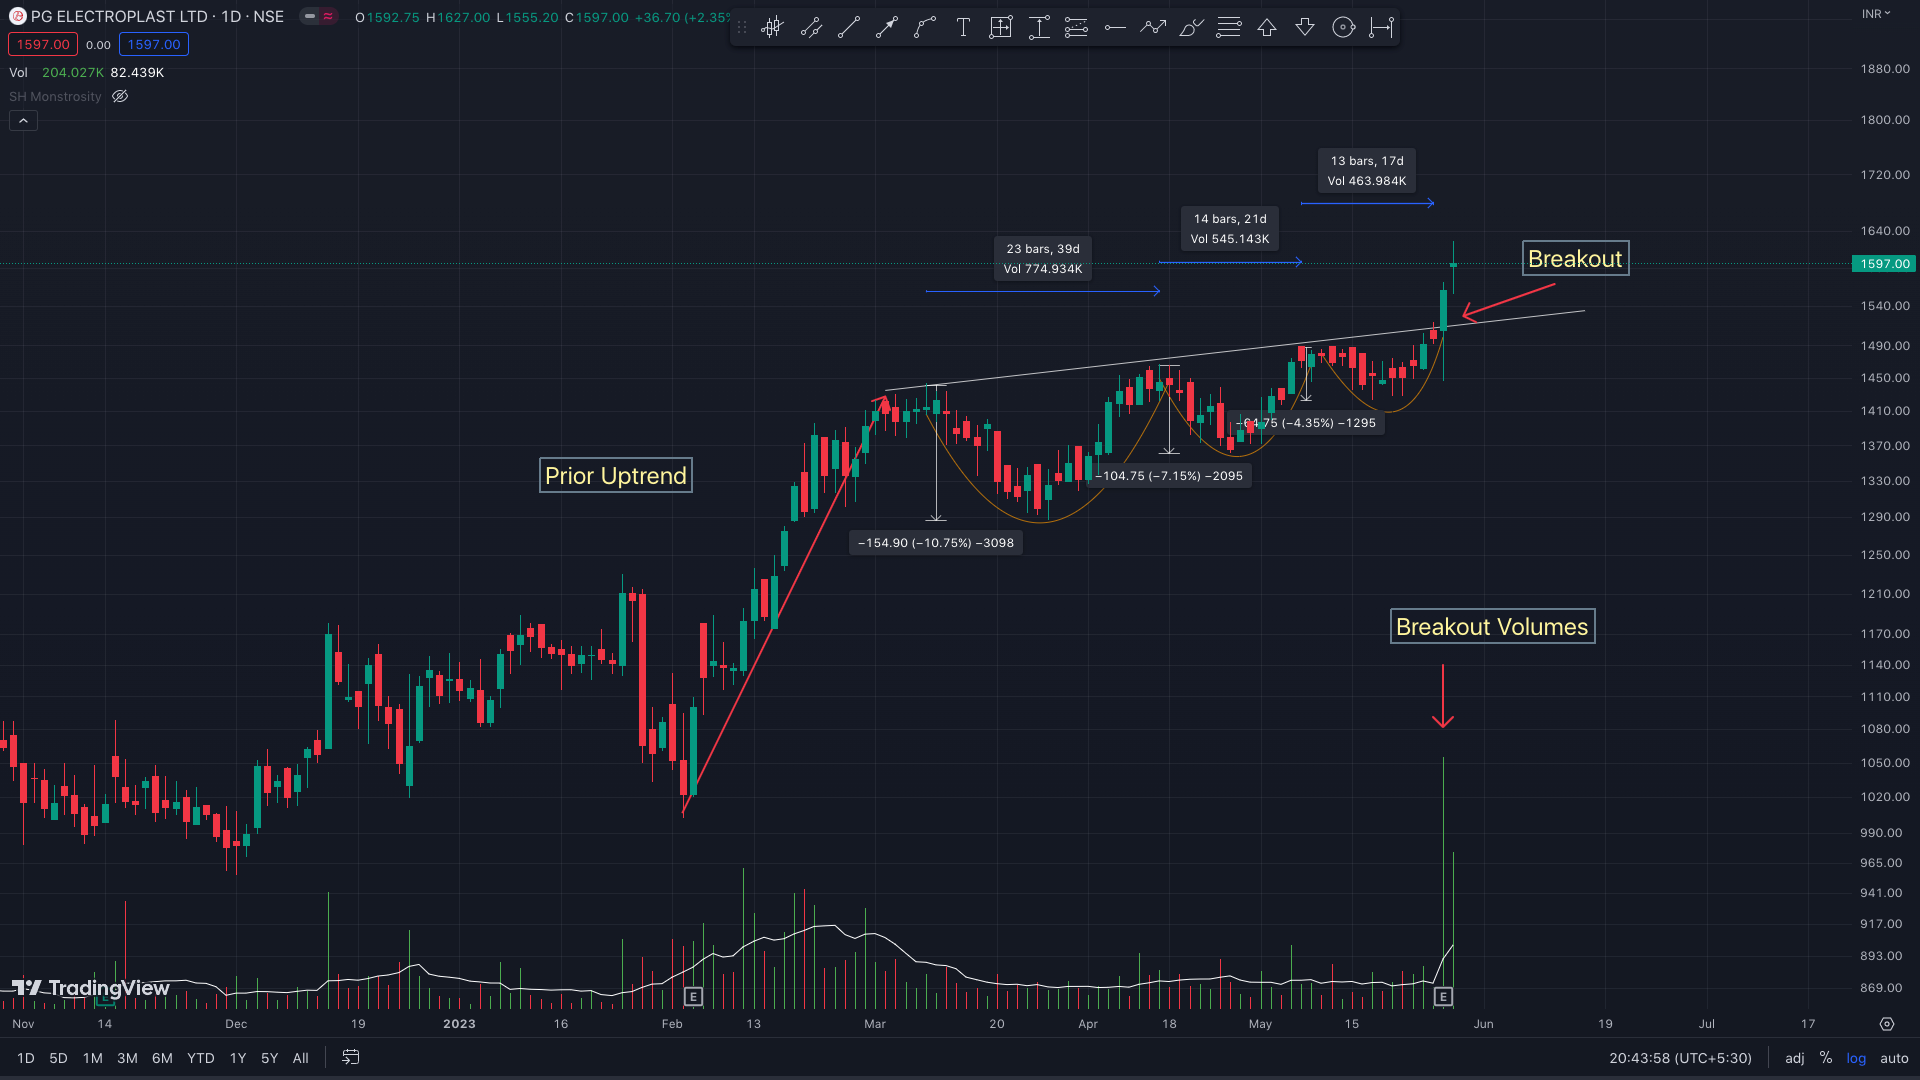
A prior uptrend: A constructive VCP needs to have a prior uptrend. Period. Without a prior uptrend, even if the base displays all the VCP characteristics, it might not result in a breakout.
Decrease in the magnitude of price correction from the left to the right side of the base:
After the uptrend, when the price starts to base (move sideways between a range), it corrects from the previous high (pivot high) to a low (pivot low). This correction can be measured in terms of a percent decline in price measured from the pivot high to the pivot low. After each correction, the price makes an up move and makes a subsequent pivot high and then a subsequent pivot low (before eventually breaking out or breaking down).
The magnitude of this correction in price (pivot high - pivot low) decreases from the left-hand side of the base, as we move to the right. This action is pivotal.
Decrease in the time taken for price correction from the left to the right side of the base:
Not only there is a decrease in the price correction, but a constructive VCP will also display a decrease in the time taken for the subsequent correction from the left to the right side of the base.
Volumes dry up from the pivot high to the pivot low:
The volumes should gradually decrease when the price pulls back to the pivot low and surge again on the up move.
Volumes dry up from the left to the right side on each subsequent correction:
The phenomenon of volume drying up on correction and surging on the up move happens on each subsequent correction. Moreover, the volumes as a whole should also go down overall, with each subsequent correction from the left to the right side of the base.
*** An important characteristic of a VCP is to have the subsequent swing highs lower than (or equal to) the 1st swing high. Any positive slope in the swing highs would make the pattern look like a rising wedge which is considered a bearish pattern.
This is conventional knowledge (from the books and YouTube videos), what I had learned and there surely is some truth in this.
But, I also have seen enough examples of a VCP where the swing highs are slightly higher than the previous highs and these would also work perfectly with a breakout to the upside (I maintained a list of such VCPs).
Hence, I would still consider them a constructive VCP (unless the slope is too high).
How many contractions can occur?
In theory, any number of contractions can occur. In Minervin lingo, a contraction is called T (because of the shape it makes on the chart).
You can now imagine, the chart patterns (bases) and tell how many Ts they have.
A rectangle has just 1 T, a Cup & Handle has 2 Ts, Triangles have 3 or more, and The Flag Mast can have anywhere from 2 to 5-6.
As long as the new contraction is smaller than the previous contraction, the price action is good.
Olectra Greentech right now is at its 4th contraction (fig below).
But what comes after the contraction?
Now surely prices cannot contract beyond 0% right?
So what happens when it reaches close to zero?
It expands (i.e. Breaks out to the upside), it goes ballistic & most often than not, if the VCP characteristics were good, this expansion comes towards the upside.
I have some examples of this below (PGEL)
In a daily timeframe, seldom does it happen that contractions come below 2%. Any contraction under 10% has an increased chance of a price expansion of more than 10% on the upside.
Some VCPs after breaking out to the upside may also fail. Whereas, in rare cases, the VCP may break down towards the downside as well. hence, trade the breakout, or if you are making an anticipation entry, use a stop loss.
PS: If a contraction moves very close to the apex of the contraction (imagine a triangle here and the closer to the apex the price moves, the more contraction happens), it can be a negative thing and Price may not break out to the upside. So just keep this point in mind.
A rule of thumb is that a good break out should come around 2/3rd of the length of the base (see example in Olectra below).

In which timeframe does VCP occur?
Like everything in the markets (& life), and I mean everything. VCPs also occur in all timeframes. They are fractals.
I will show you an example each of VCP in monthly, daily, and 30-minute timeframes below:
VCP in Monthly: Hind Rectifiers


VCP in Weekly: Eclerx

VCP in Daily: PGEL

VCP in intraday Timeframe: Sapphire

Finding VCP is just 1 pillar of trading that tells you WHERE to buy. To be consistently profitable, one needs to have a systems that answers these following questions as well viz. WHEN to buy? WHICH stocks to buy? HOW MUCH to buy and WHERE to get out?
If you want to cut short your learning curve and become consistently profitable as soon as possible, you need to learn trading in a systematic yet simple way.
Join the Trading Systems Masterclass for Beginners
If you are tired of seeing a 10%-15% gain fizzle out and become zero- then this is your next step.
In this Masterclass, I’ll teach you how to build your own personalized trading systemthat:
Spots low-risk entries before they become obvious
Focuses on the strongest stocks — not just anything that moves
Keeps your trading calm, consistent, and disciplined
And much more………
This isn’t about random tips or chasing breakouts. It’s about giving you a repeatable system — so you're never left guessing when it’s time to act.
👉 Click here to for more details on Trading Systems Masterclass for Beginners
Seats are limited — and clarity like this can change your trading forever.
The Early Bird offer ends on 17th June.

Homma Private Access membership:
HPA is a subscription-based educational service and community (on WhatsApp). Benefits include:
Daily Market Breadth, Momentum, Sector Rotation, and Relative Strength Update.
Access to all my scanners {including the BBB (buy before breakouts), HTF, Stage2 breakout, Homma Khela hobe 2.0}.
Access to my breadth-Momentum-Relative Strength & Sector Rotation dashboards.
Access to my Trading view indicators.
Homma Endgame.
Homma Triple B ultra pro max.
Homma Khela Hobe.
HPA Weekly: Hourly weekend deep dives and Q&A.
1-year access to The Technical Take premium.
Live updates on my portfolio and the trading setup rationale.
Access to my high probability watchlist (HTF watchlist).
Yearly membership of 12000/- INR only.
UPI payment & WhatsApp @ 9481506784.
If you are an intermediate level trader, who needs a constant mentoring to improve your existing system, consider joining the Homma Private Access.
I help traders build their trading systems and show mine daily in HPA.
(PS: 1-month free HPA access is complementary with the Masterclass)
Details below:
Homma Private Access membership:
HPA is a subscription-based educational service (on WhatsApp). Benefits include:
Daily Market Breadth, Momentum, Sector Rotation, and Relative StrengthUpdate.
Access to all my proprietary scanner toolkits, including the BBB (buy before breakouts) scanner and the Homma Khela Hobe 2.0 scanner.
Access to my proprietary Breadth-Momentum-Relative Strength & Sector Rotation dashboards.
Access to my Trading View indicators: Mswing indicator, Homma Khela Hobe, Buy before Breakouts (BBB), etc.
HPA Weekly: Hourly weekend deep dives and Q&A.
1-year access to The Technical Take premium.
Access to the daily Ranked Mswing Relative Strength Top 100 watchlist.
Yearly membership of 15000/- INR only (UPI: sakatashomma@sbi)
WhatsApp @9481506784
Yours
Sakatas Homma
Some Peak Scanners for you:
High Tight Flag: https://chartink.com/screener/copy-shhtf
Pullback to 10/21 ma: https://chartink.com/screener/copy-shpb1021
VCP (long-term timeframe): https://chartink.com/screener/shvcp-epic-modified
U summarized mark’s book ., one step ahead n in easy words as well
Great blog. I am intrigued by the various definitions of the term volatility. I see you define it as: "Volatility: the price swing from a pivot high to a pivot low measured in terms of percentage."
Could you point me to any reference where I can find this definition?