


Simplifying Divergences: "Bearish Divergence" in Gold?
And the biggest mistakes beginners make that you should avoid.

And so, there has been chatter about Gold lately.
Mostly about its bullishness.
But there are bearish noises around, too.
There seems to be a “Bearish Divergence,” or rather, this divergence has been going on for a while.
Should you be bearish then?
In this article, I am going to discuss:
Simplifying the concept of Divergence.
What comes after divergence?
Types of Divergence.
The biggest mistakes beginners make that you should avoid.

What is DIVERGENCE?
Divergence is a condition where the price of an asset is moving in the opposite direction of its technical indicator, most commonly an oscillator like RSI, MACD, or momentum (Mswing).
They can be broadly classified into 2 types: Bullish Divergence and Bearish Divergence.
Any divergence in the swing lows is classified as Bullish, while in the swing highs is classified as Bearish.
As the name suggests, Bullish divergence has bullish price implications, whereas Bearish divergences have bearish price implications.
They can be further classified as a regular divergence or a hidden divergence. A regular divergence has a REVERSAL implication, whereas a hidden divergence has a CONTINUATION implication.
Let me explain in more detail below.
But before that,
What comes after Divergence?
Resolution of the Divergence.
Meaning,
The price starts to follow the trend of the indicator, or the indicator now starts to behave like the price.
We will see examples of resolution below.
(Regular) Bullish Divergence:
A Regular bullish divergence occurs when the price makes a lower low, but the indicator (e.g., RSI, MACD) makes a higher low.
As the name suggests, Bullish divergence has bullish price implications.
Interpretation: This suggests that while the price is still moving lower, the momentum of that downtrend is weakening.
This may signal an impending trend reversal to the upside.
Hidden Bullish Divergence:
A hidden bullish divergence occurs when the price makes a higher low, but the indicator (e.g., RSI, MACD) makes a lower low.
Interpretation: This suggests that even though the indicator is showing weakened momentum, the price is still trending upward (higher low).
This may signal a continuation of the uptrend.
Key Differences in Regular vs Hidden Bullish Divergence:
Price Action vs. Indicator Behavior:
Bullish Divergence: Price is making lower lows, but the indicator is making higher lows.
Hidden Bullish Divergence: The Price is making higher lows, but the indicator is making lower lows.
Trend Implication:
Bullish Divergence: Indicates a potential reversal from a downtrend to an uptrend.
Hidden Bullish Divergence: This suggests a potential continuation of the prevailing uptrend after a pullback.
(Regular) Bearish Divergence:
A Regular bearish divergence occurs when the price makes a higher high, but the indicator (e.g., RSI, MACD) makes a lower high.
As the name suggests, Bullish divergence has bearish price implications.
Interpretation: This suggests that although the price is still moving higher, the bullish momentum is getting weaker.
This may signal an impending trend reversal to the downside.
Hidden Bearish Divergence:
A Hidden bearish divergence occurs when the price makes a lower high, but the indicator (e.g., RSI, MACD) makes a higher high.
Interpretation: The indicator may show strength, but the price structure is still weak.
The downtrend may likely continue after a small bounce.
The Mistake:
1st Rookie mistake: To call it a divergence even before a swing high is confirmed.
2nd Mistake: To act without Price confirmation.
In strong trending stocks, overbought/oversold can remain so for a longer period.
The trend may not reverse after one round of divergence, but it often requires more rounds of divergence.
Even after multiple rounds, the divergence may resolve in the direction of price. Hence, it is always prudent to wait for the price confirmation of the reversal.
Let’s discuss all this with some examples here.
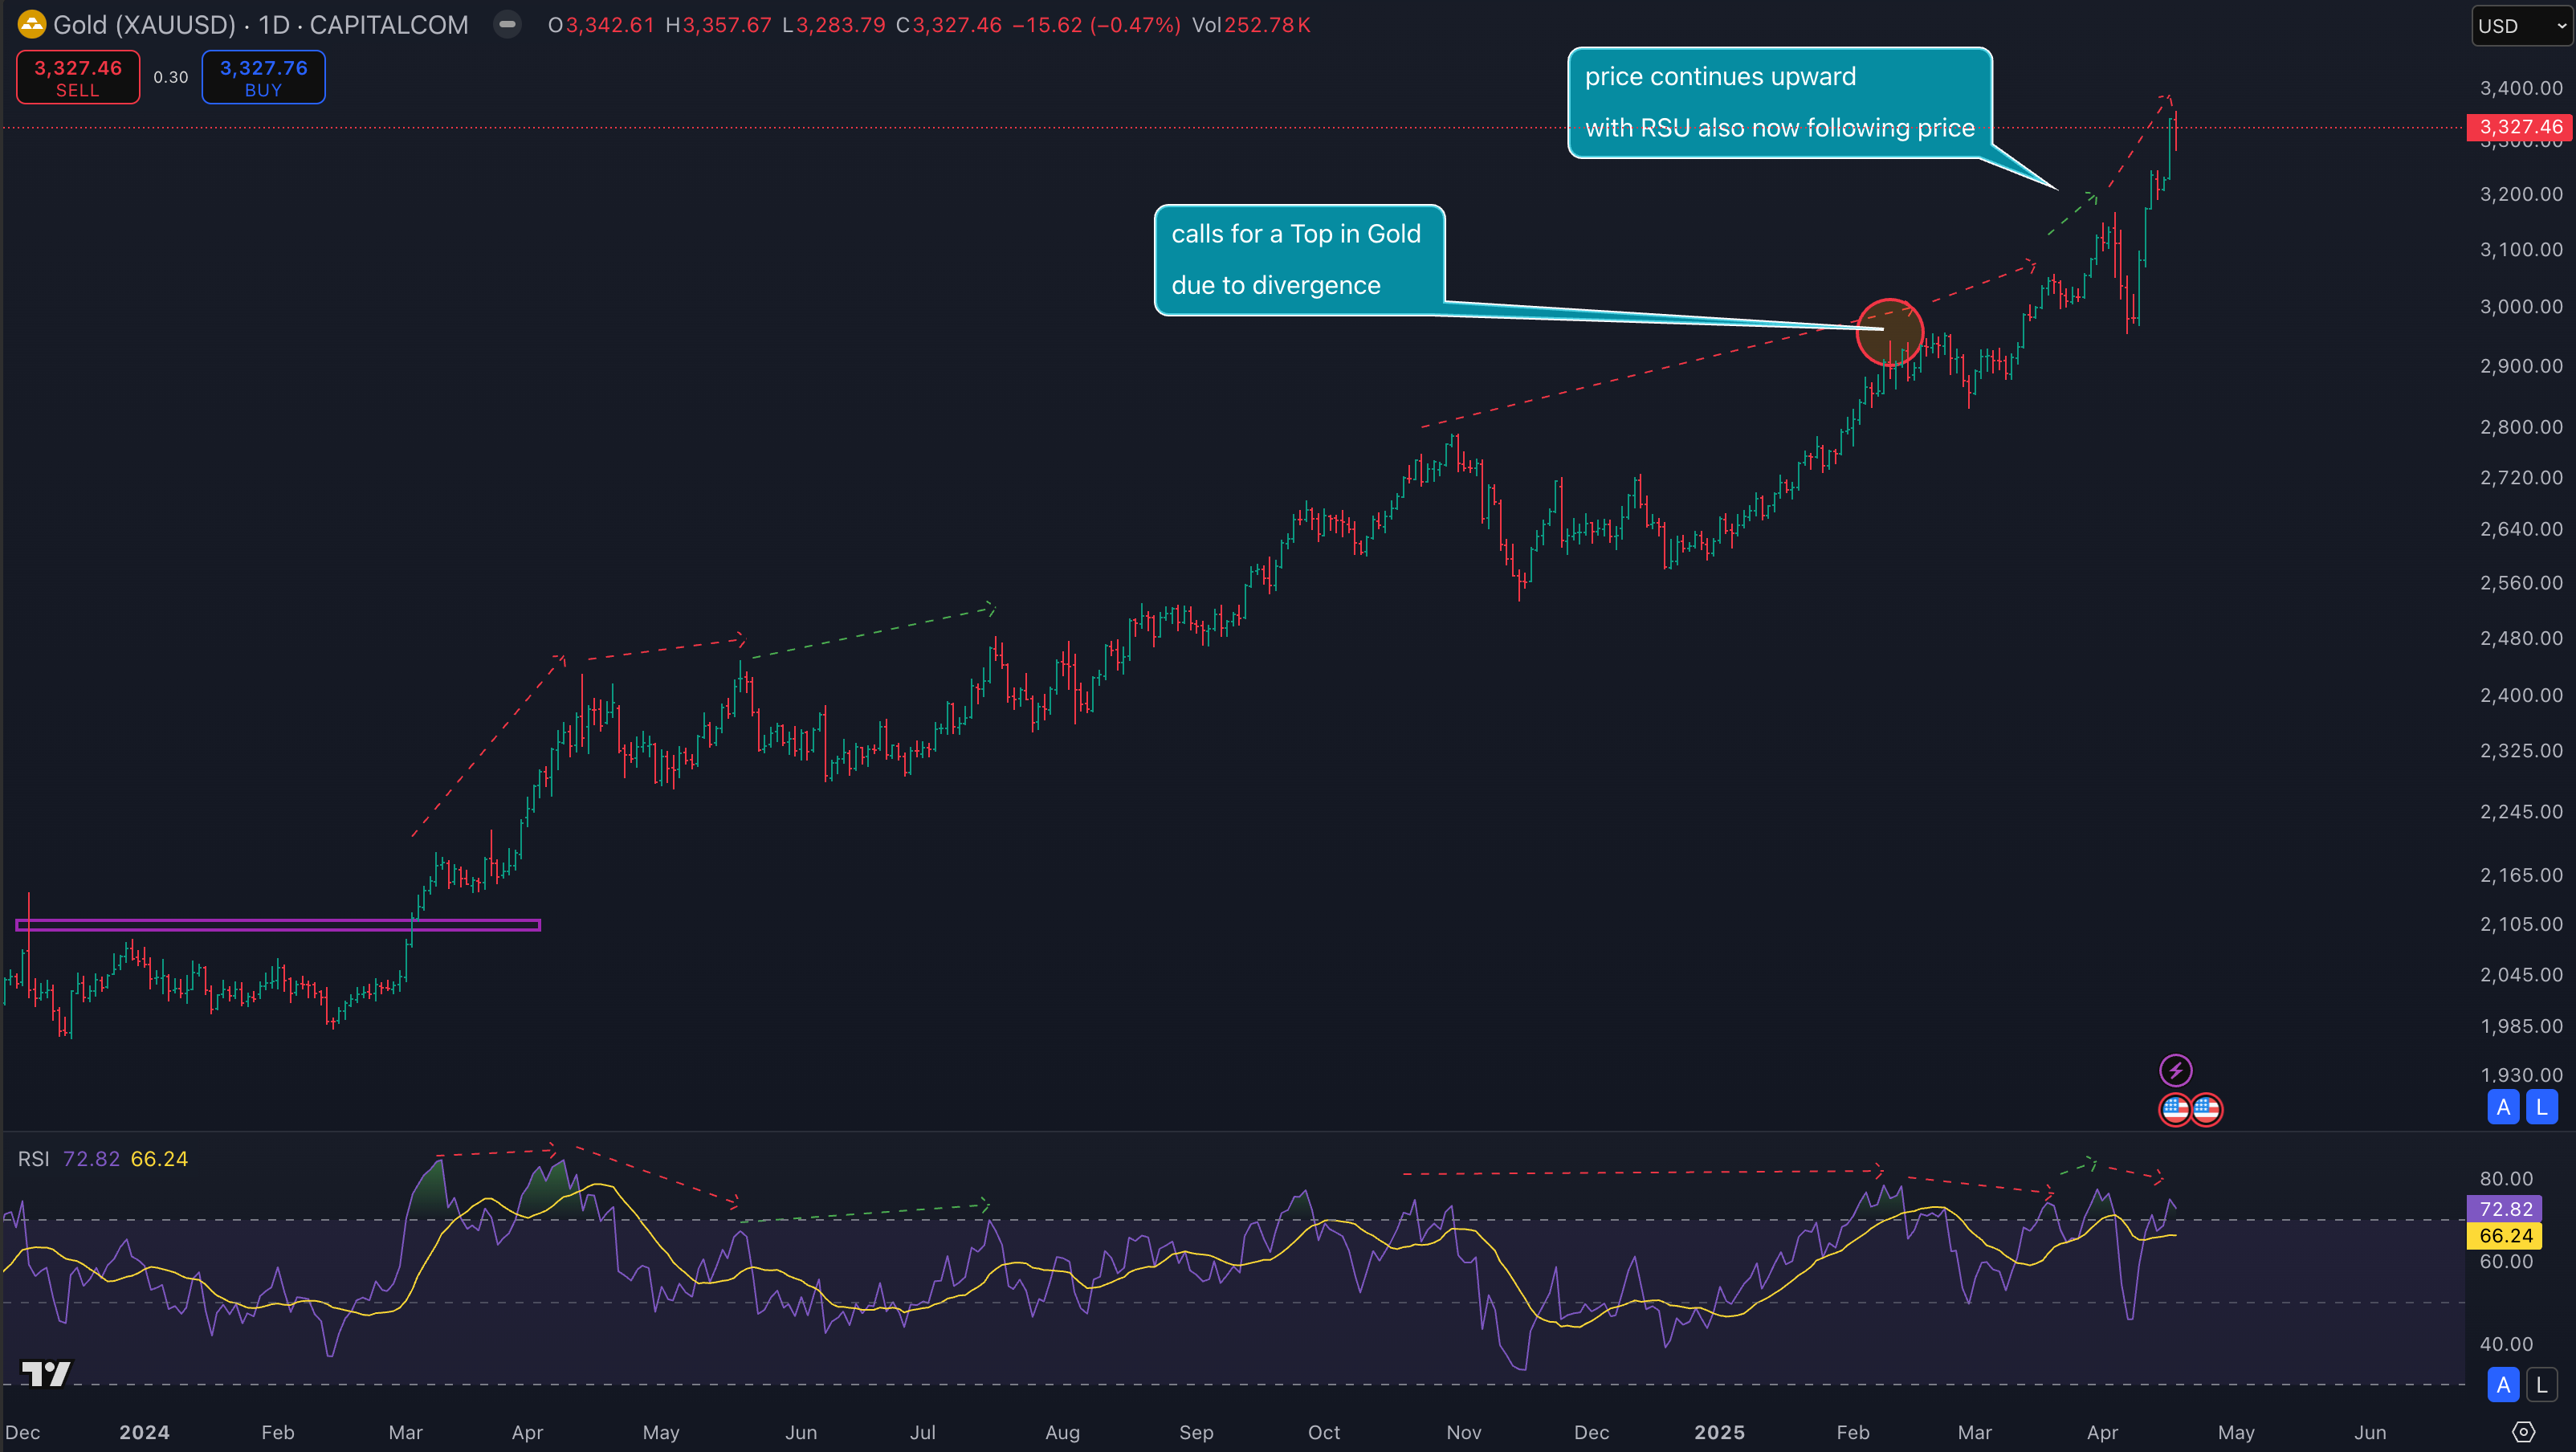
Bearish divergence in Gold
The figure below shows 2 points where bearish divergence occurred.
In both cases, the divergence was resolved in favor of price rather than the indicator.
It’s currently showing another Bearish Divergence.
Will it eventually Top?
Yes
But will it be because of the divergence?
Maybe Not.
Let’s look at another example:
Nifty Midsmall400 had multiple rounds of bearish divergence before the price reversal finally played out.

Finally, I will leave you with the question.
“Is divergence useful at all?”
I think they can be good as short-term signals and can be used as confluence with other signals.
But it shouldn’t be relied upon as a primary signal.
Here is a more indepth explainer video on Divergences: (Link)If you are a beginner looking to SIMPLIFY your trading.
I conduct my Annual Beginners Trading Masterclass once a year (around July).
Last year, it was all about Trading Systems.
If you find my articles valuable, you will find the Masterclass 100 times more useful.
You can now take advantage of the recorded session.
Details of the masterclass are below.
Trading System Masterclass for Beginners
·
July 12, 2024

The Annual Sakatas Homma’s Beginners Trading Masterclass is finally here. This year, it will be all about the trading system. Your unique trading system. Excited! would be an understatement. Details Below.
That's all for today.
I also help traders build their trading systems and show mine daily in HPA (Homma Private Access).
(PS: 1-month free HPA access is complementary with the Masterclass)
Details below:
Homma Private Access membership:
HPA is a subscription-based educational service (on WhatsApp). Benefits include:
Daily Market Breadth, Momentum, Sector Rotation, and Relative Strength Update.
Access to all my proprietary scanner toolkits, including the BBB (buy before breakouts) scanner and the Homma Khela Hobe 2.0 scanner.
Access to my proprietary Breadth-Momentum-Relative Strength & Sector Rotation dashboards.
Access to my Trading View indicators: Mswing indicator, Homma Khela Hobe, Buy before Breakouts (BBB), etc.
HPA Weekly: Hourly weekend deep dives and Q&A.
1-year access to The Technical Take premium.
Access to the daily Ranked Mswing Relative Strength Top 100 watchlist.
Yearly membership of 15000/- INR only.
UPI payment & WhatsApp @9481506784
Yours
Sakatas Homma.