

"You do not rise to the level of your goals, you fall to the level of your systems." ~ James Clear, Atomic HabitsMarkets have been sideways and trying to bounce from the supports this week.
Some of the common thoughts you might have to deal with at this point would be:
Will the markets bounce?
What if I get in now and it breaks down?
What if I do not enter now and the market shoots up?
What if I then enter late and the market Tops and reverse?
You are not alone my brother. Everyone goes through these questions, at least at the beginning of their trading career. But once you have a system in place to see if “THEY” are buying or selling, then you will start to have answers.
In this article, I will tell you about a simple primary breadth indicator that will help you answer the question, “Did they buy (or sell) today?”
4% movers.
How to use it to confirm the change in the market regime?
“Did they buy the markets today”?
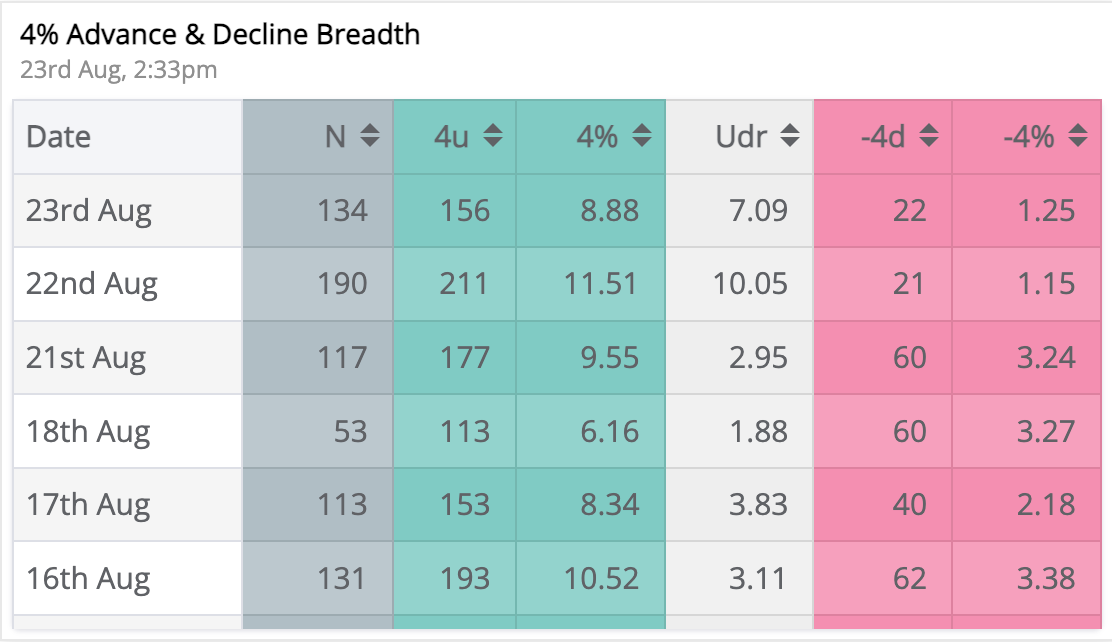
4% movers:
4% Up movers: Total number of stocks that moved up 4% or more.
4% Down movers: Total number of stocks that moved down -4% or more.
These numbers can also be plotted as a percentage.
Net Up Down movers (N): 4% Up - 4% Down
Up Down Ratio (UDR): 4% Up/ 4% Down
Why 4%?
This number directly comes from the work of Pradeep Bonde (from Stock Bee), that’s where I learned it from, and later also saw Chhirag Kedia aka Swing ka Sultan’s work on this)
A 4% move is a significant move. Much more than the average volatility of a stock. 4% moves up or down can only come with high strength and shows the true strength or weakness in a stock. A 4% up move tells you conclusively that they bought and a 4% down move tells you that they sold (in most cases. However, using volume data tells you this even more accurately.
In essence, you can use a different number too, 3.5% or 5% should also work.
4% movers data to detect the change in the market regime?
Net 4% Up Down plot (N):

Plotting N as a function of time gives you a very good reading of buying and selling in the market.
A positive N value for a prolonged time means a bullish regime. Similarly,
A negative N value for a prolonged time means a bearish regime.
A transition from an extremely negative N (after a longer period) to an extremely positive N value could signal a bearish to bullish regime change (see on 1st April 2023) and vice versa.
In terms of %, spikes of N >20% are extremely bullish whereas spikes of N < -20% are extremely bearish.
These spikes should not be viewed per se but in concert with market conditions. For example, a -20% spike after a prolonged +ve N period would mean a possible bearish regime incoming, whereas during an already existing downtrend would mean nothing more than that the bearishness will persist.
You may have also noticed that these plots are noisy. To smoothen the curve, a simple moving average (5ma or 10ma) is used. (Too much work to plot this in Chartink. But Nitin (yes, Finally Nitin) has done it for all of us. In case you are curious, I will leave the link to his dashboard created in line with the works of Pradeep Bonde at the end of the article)
“Did they buy the markets today”?
Just look at UDR = Up down Ratio to get your answer.
UDR will be:
On a bullish day, >5
Ultra bullish day, >10
sideways day: 1-5
Bearish day, <1
ultra bearish day, <0.25
(I just made up these bin numbers. No seriously)
Updated on 5th March 2025:
We are in a Bear Market.
The net 4% breadth is still useful for anticipating bottoms and tops and judging the strength of the rallies.
I have updated the Table and added a few more metrics (Link to the updated Breadth sheet at the end of the article). All of these are supplementary to the existing breadth metrics and will 99% give us same signals.
4.5R (MBI waale): This is a ratio of 4.5% movers * 100/ -4.5% movers. Popularised by Umang Tiwari from Stocksgeek and now widely used by Indian Swing Trading Fraternity.
Z%: This is the average % price change per day. Positive and Higher = Highly bullish.
AD 1day: This is “% Net advances”. Positive and Higher - Highly Bullish.
Also added a line chart for the 4.5R separately (Shows a Breakout of 4.5R in 4 months today if sustained)

As a trader, I am a huge believer in “Timing” the market.
After 4 years in the market, I finally have a system in place that signals with high accuracy the regime changes and helps me in timing the markets with high accuracy.
But I did not reach here in a day.
The journey has been painful.
If you wanna cut short the first 2 years of pain and frustration in the market.
You can start here:
I conduct my Annual Beginners Trading Masterclass once a year.
This year it was all about Trading Systems.
If you find my articles valuable, you will find the Masterclass 100 times more useful.
You can now take advantage of the recorded session.
Details of the masterclass are below.
Trading System Masterclass for Beginners
·
July 12, 2024

That's all for today.
I also help traders build their own trading systems and show mine daily in HPA (Homma Private Access).
(PS: 1-month free HPA access complementary with the Masterclass)
Details below:
Homma Private Access membership:
HPA is a subscription-based educational service (on WhatsApp). Benefits include:
Daily Market Breadth, Momentum, Sector Rotation, and Relative Strength Update.
Access to all my scanner toolkit including the BBB (buy before breakouts) scanner, and the Homma Khela Hobe 2.0 scanner.
Access to my proprietary Breadth-Momentum-Relative Strength & Sector Rotation dashboards.
Access to my Trading view indicators: Mswing indicator, Homma Khela Hobe, Buy before Breakouts (BBB), etc.
HPA Weekly: Hourly weekend deep dives and Q&A.
1-year access to The Technical Take premium.
Access to the daily Ranked Mswing Relative Strength Top 100 watchlist.
Yearly membership of 15000/- INR only.
UPI payment & WhatsApp @ 9481506784.
Yours
Sakatas Homma.
Net 4% Breadth Homma: https://chartink.com/dashboard/314654
Pradeep Bonde’s Breadth Dashboard by Nitin: https://chartink.com/dashboard/176017
Nitin’s tweet explaining the dashboard:
https://twitter.com/finallynitin/status/1674425212694327298?s=20
Great of you to acknowledge the traders👏👏 great post bro!!