"Cut your losers & let your winner run" ~ a Peak Trend Follower
Welcome to the third and final article of the Breadth Template series.
A series of articles discussing all the Trend-Momentum templates through which you can gauge the Trend and Momentum of the market. These are essentially breadth indicators.
Read the first article on Mswing and the second article on Landry score.
I will discuss the Minervini Trend Template today.
A template to find “stocks in an uptrend” by one of the greatest traders of our generation, Mark Minervini.
The Minervini Trend template:
Here are the conditions for a stock to fulfill for Minervini to consider it in a defined uptrend:
Close above the 150-day SMA and 200-day SMA.
150-day SMA is above the 200-day SMA.
The 200-day SMA has been trending up for at least 3 months.
the 50-day SMA is above both the 150 and 200-day SMA.
The current close price is above the 50-day SMA.
The current close price is within at least 25% of the 52-week high price. lastly
The current close price is at least 30% above the 52-week low price.
Scanner for the Minervini Trend template:
Here is the scanner I wrote on chartink.
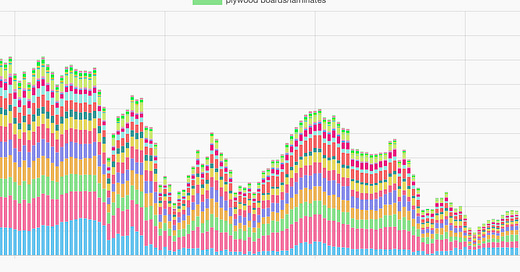
Results as of 21st March 2025 show only 117 stocks on an uptrend which is around 5% of the total NSE universe.
This number has been languishing below 100 since the start of the year. It has started to trend up from last week, but still not in bullish territory yet. In a peak bull run, this number can easily run to the 1200s ie 60% of the total NSE stocks.
How to Interpret the Market Breadth using the Minervini Trend Template:
Quite simple actually.
A falling plot means decreasing market strength.
A rising plot means increasing market strength.
Plot above the ~400 threshold, the market is in a bullish regime. Below that, the market is in a bearish regime.
Here is another way to read the Market based on this plot:
Above Threshold and rising = Easy Money
Above Threshold and declining = Hard Money
Below threshold and rising = Hard Money
Below threshold and declining = No Money
Risk management remains the foundation of successful trading.
But my hierarchy for easy money differs from the conventional one, placing the market environment and relatively strong stocks above all.
Therefore, as a trader, identifying the right market environment for trading is my top priority.
If you are looking for a place to start your Trading & investing journey,
I conduct my Annual Beginners Trading Masterclass once a year.
This year it was all about Trading Systems.
If you find my articles valuable, you will find the Masterclass 100 times more useful.
You can now take advantage of the recorded session.
Details of the masterclass are below.
Trading System Masterclass for Beginners
·
July 12, 2024
That's all for today.
I help traders develop their own trading systems and share mine daily in HPA (Homma Private Access). (PS: 1-month free HPA access complementary with the Masterclass)
Details below:
Homma Private Access membership:
HPA is a subscription-based educational service (on WhatsApp). Benefits include:
Daily Market Breadth, Momentum, Sector Rotation, and Relative Strength Update.
Access to all my scanner toolkit including the BBB (buy before breakouts) scanner, and the Homma Khela Hobe 2.0 scanner.
Access to my proprietary Breadth-Momentum-Relative Strength & Sector Rotation dashboards.
Access to my Trading view indicators: Mswing indicator, Homma Khela Hobe, Buy before Breakouts (BBB), etc.
HPA Weekly: Hourly weekend deep dives and Q&A.
1-year access to The Technical Take premium.
Access to the daily Ranked Mswing Relative Strength Top 100 watchlist.
Yearly membership of 15000/- INR only.
UPI payment & WhatsApp @ 9481506784.
Yours
Sakatas Homma.


