"Creativity is more important than discipline in trading" ~ Stock Bee (Pradeep Bonde)
Question:
What are the breadth indicators to look at to confirm that a market bounce (reversal)?
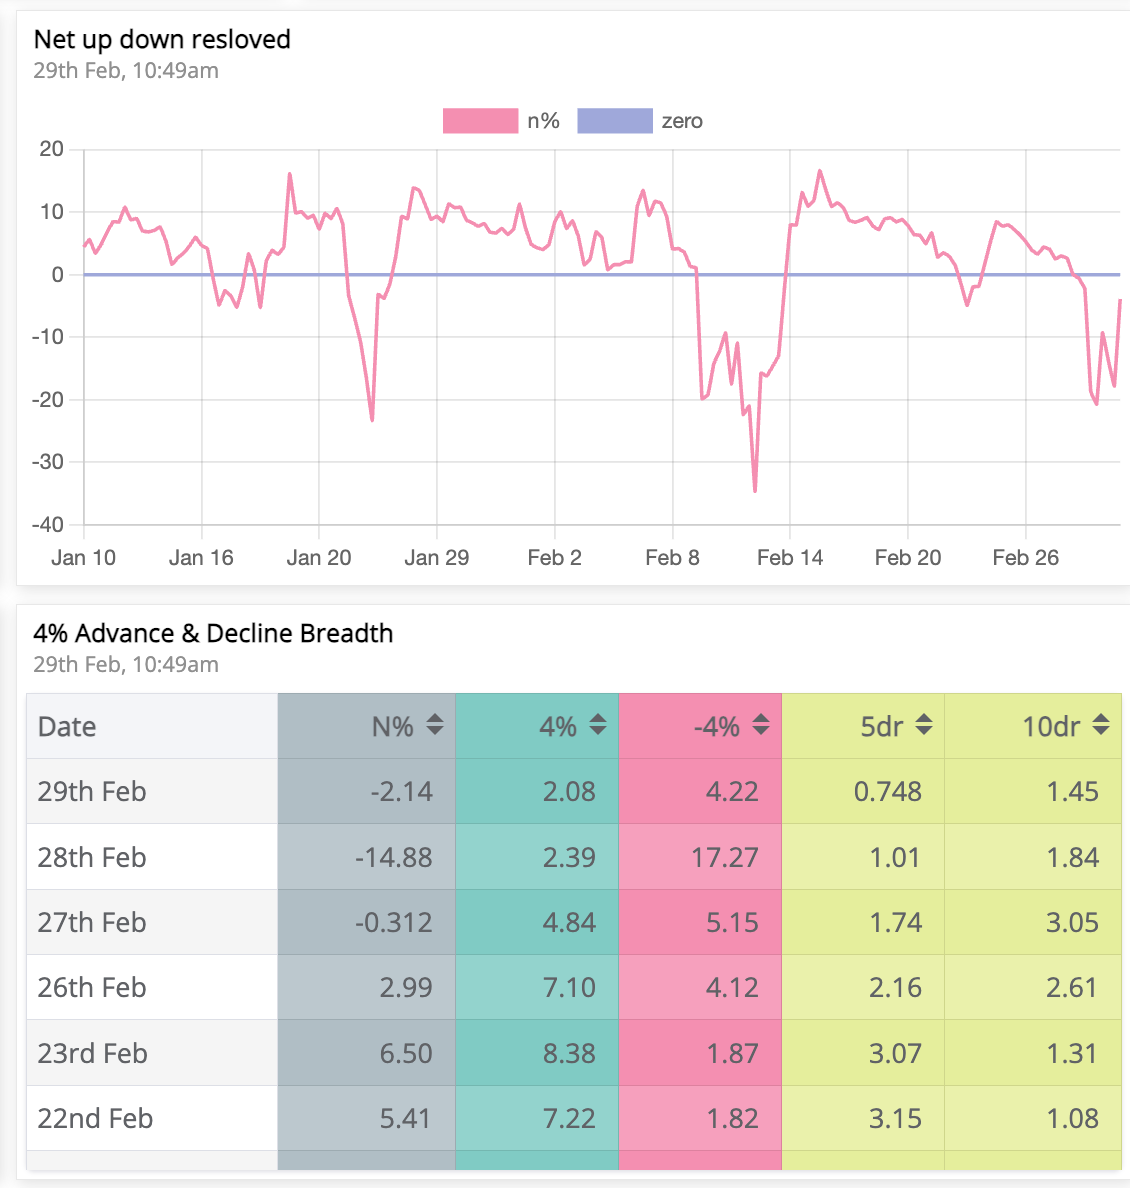
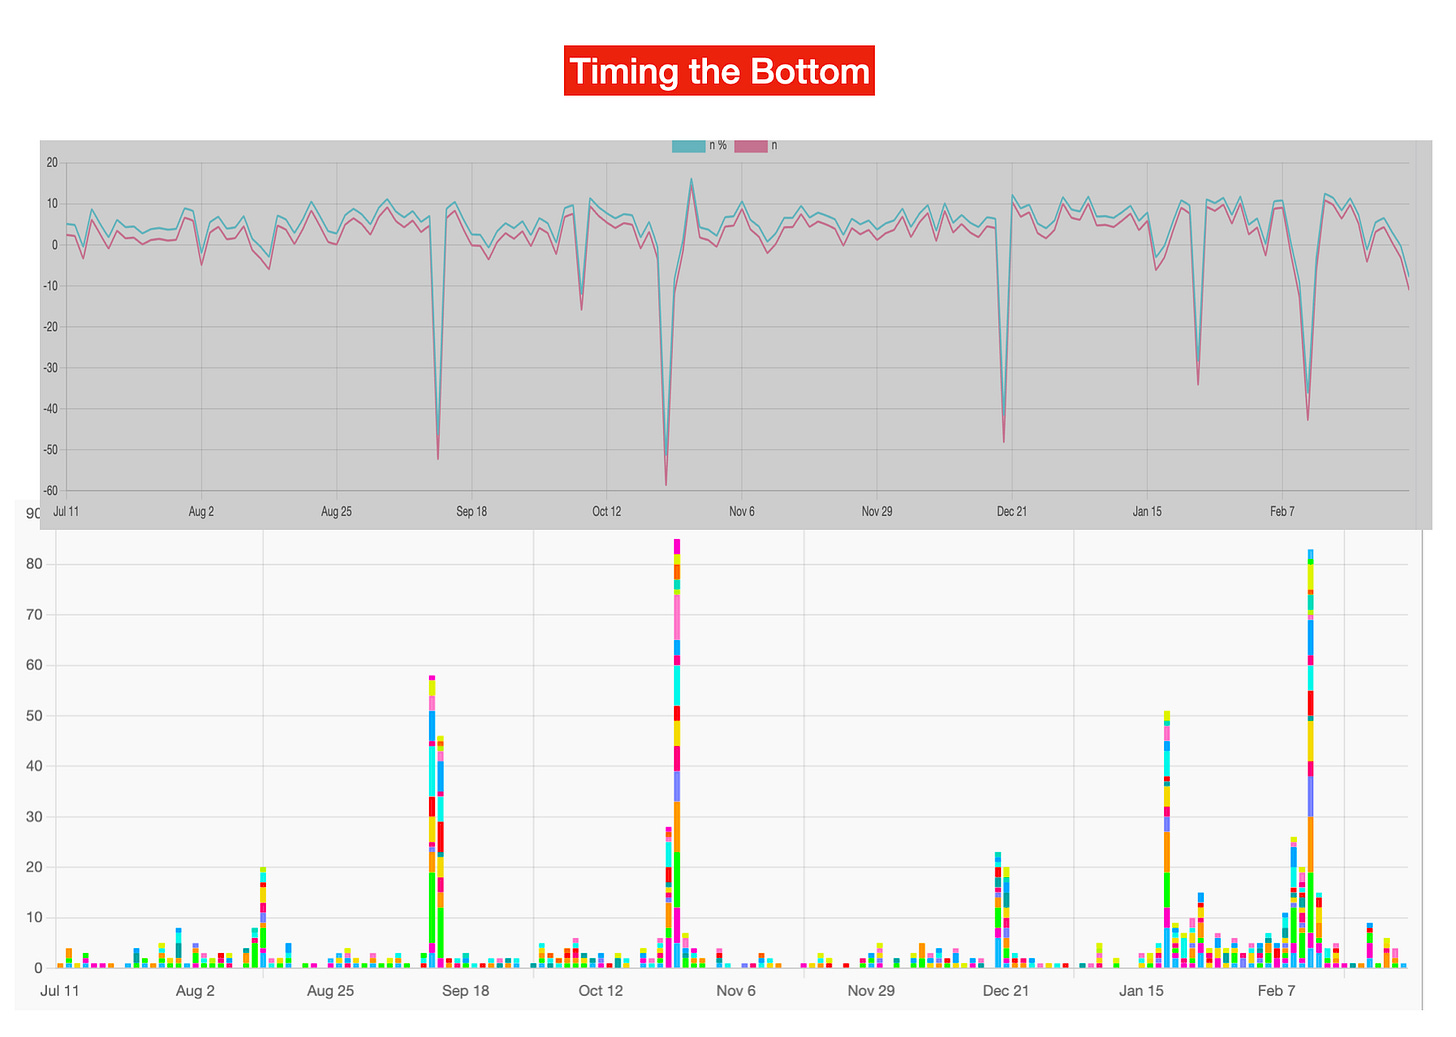
1. Net 4% Movers: TURNING POSITIVE
4% movers have to exceed -4% movers.
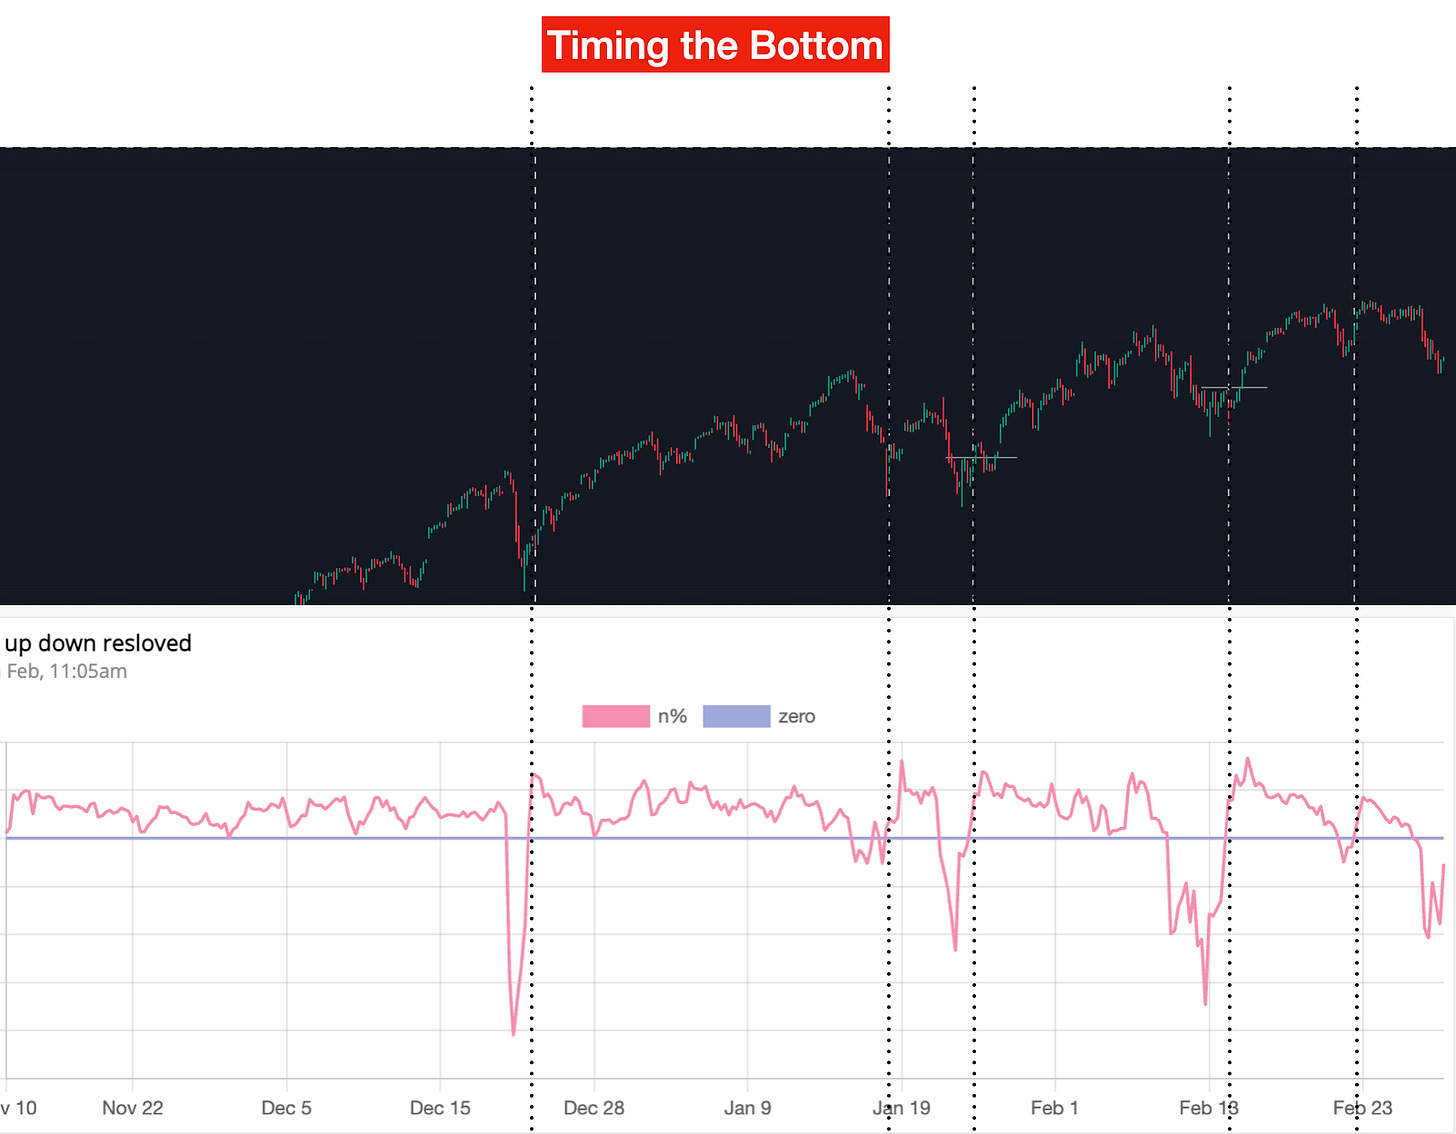
See the data below. Every time we have a bounce, Net 4% movers turn positive:
Top: Nifty 500 in 60 min timeframe.
bottom: Net 4% movers in 75 minutes timeframe.
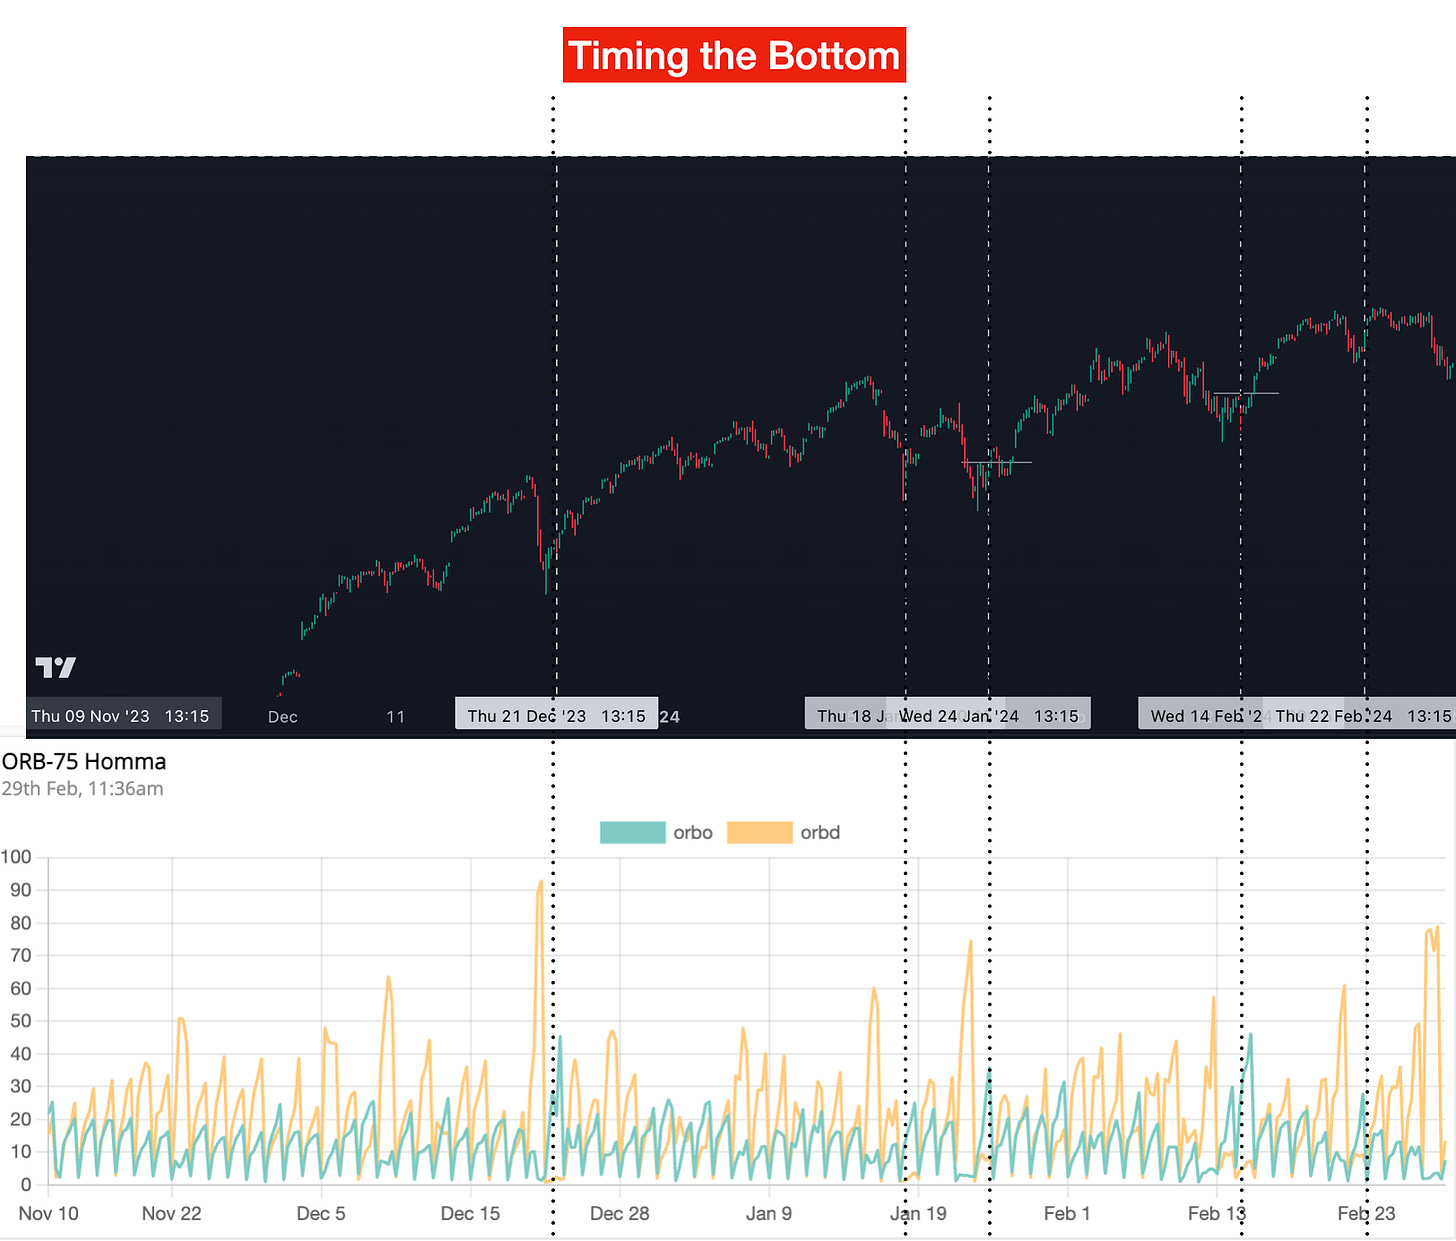
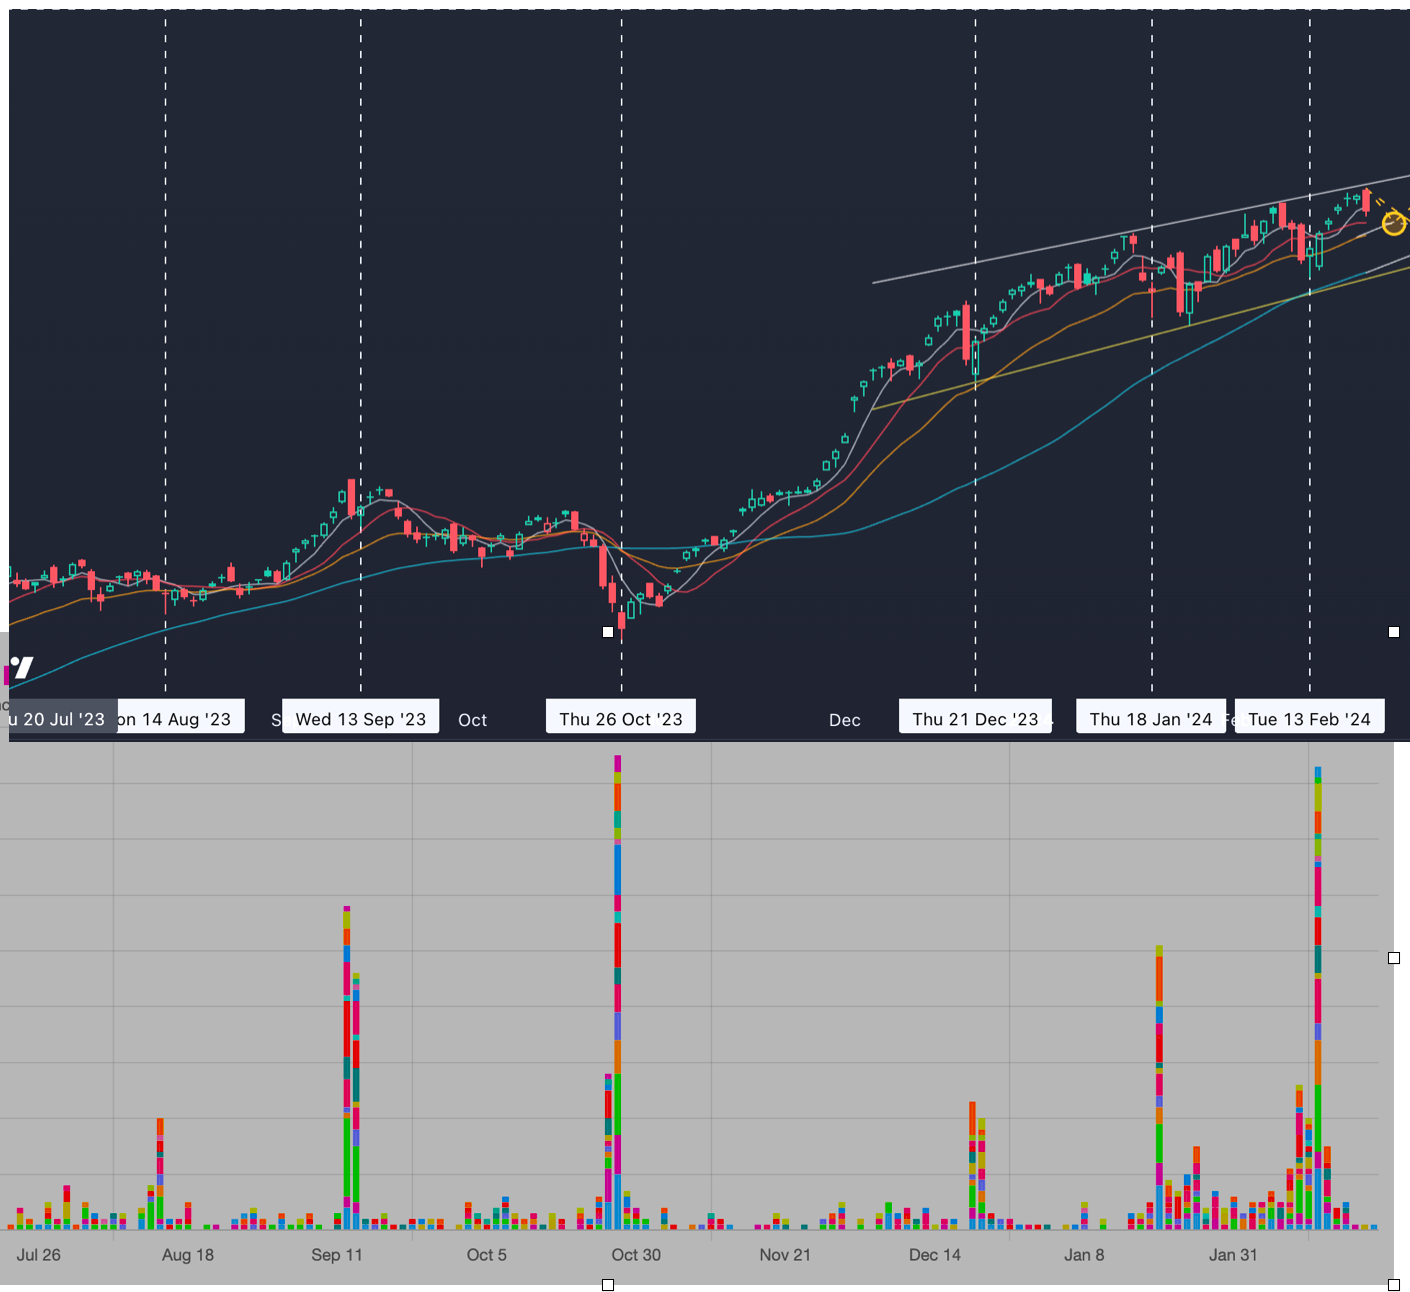
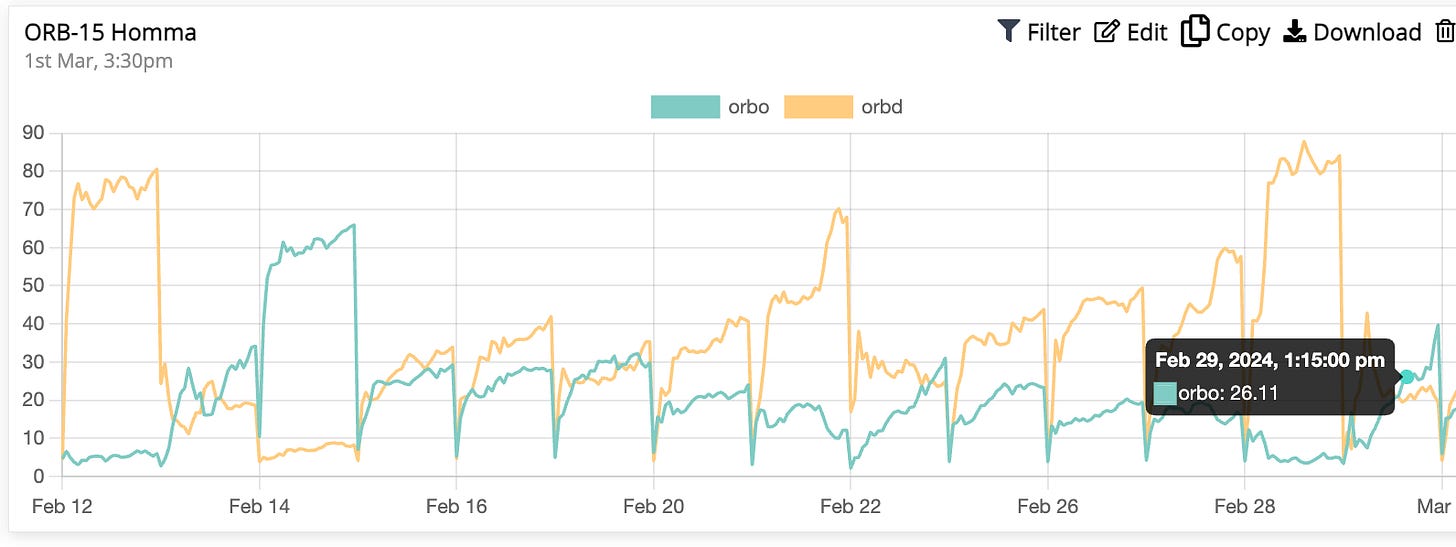
Homma ORBO indicator: Crosses ORBDs
The ORBOs will turn bullish on the bounce.
The image below shows ORBO (75 minutes) in green. ORBO cross-over ORBD (open range breakdowns) with a higher-than-average (during the pullback/ downtrend period) spike.
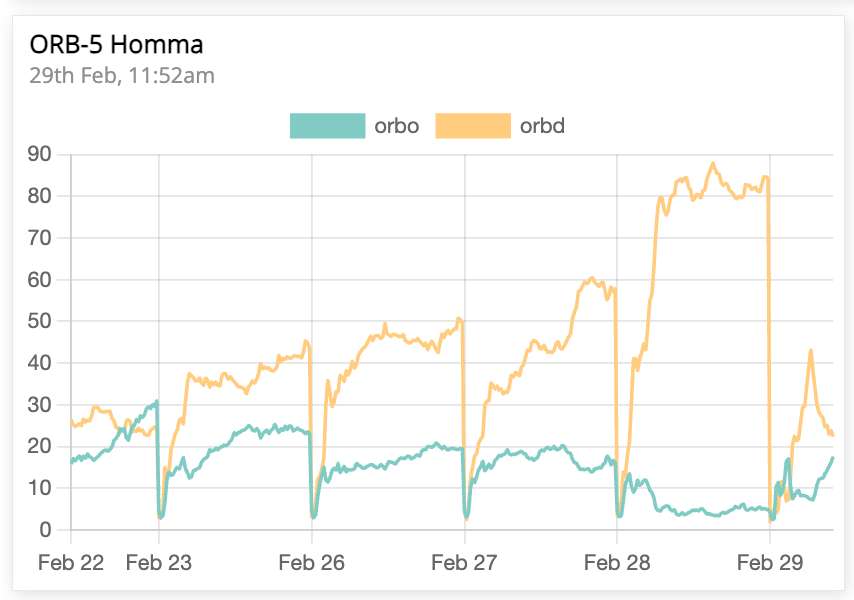
For early signals, I use ORBOs in a 5-minute timeframe.
Number of Shakeouts: Look for spikes
The logic here is simple.
On the bounce/reversal day (and/or the day prior), more often than not, the bounce materializes later in the day around close. The price breaks down from multiple pivot lows before reversing. These are called shakeouts.
8 out of 10 times, the number of shakeouts will spike on the bounce day (or the previous day).
The image below shows how beautifully, the 4% net moves, N500 bounce and the shakeout peaks (histogram bars) coincide together.
This signal, however, is not a clear one.
At times, when the bounce does not have a shakeout, it may not spike.
Confirming the price action of market indices to see if they are showing long-tailed candles is a good practice. If they do, there is a higher probability of the shakeout numbers to spike.
Where are we now?
What you read until this point was prepared around 1 pm on 29-Feb-2024 (Thursday).
Breadth changed by the end of the day (EOD).
And here we are.
Let's see how and when the signals are triggered.
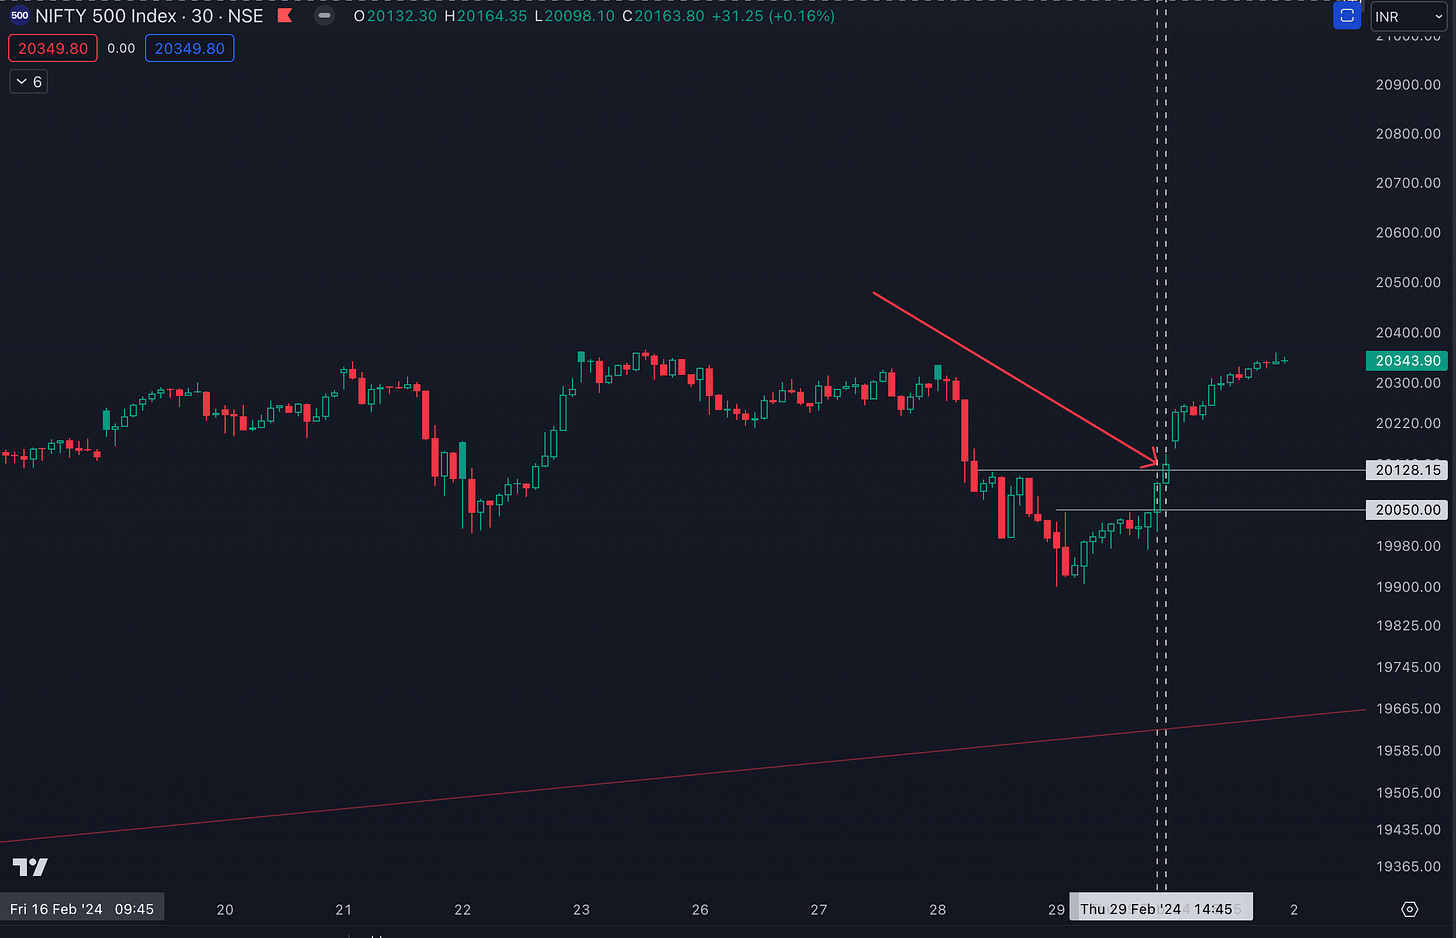
Primary signal: THE PRICE
Broke out of the pivot high to make a higher high around 2.30 pm.
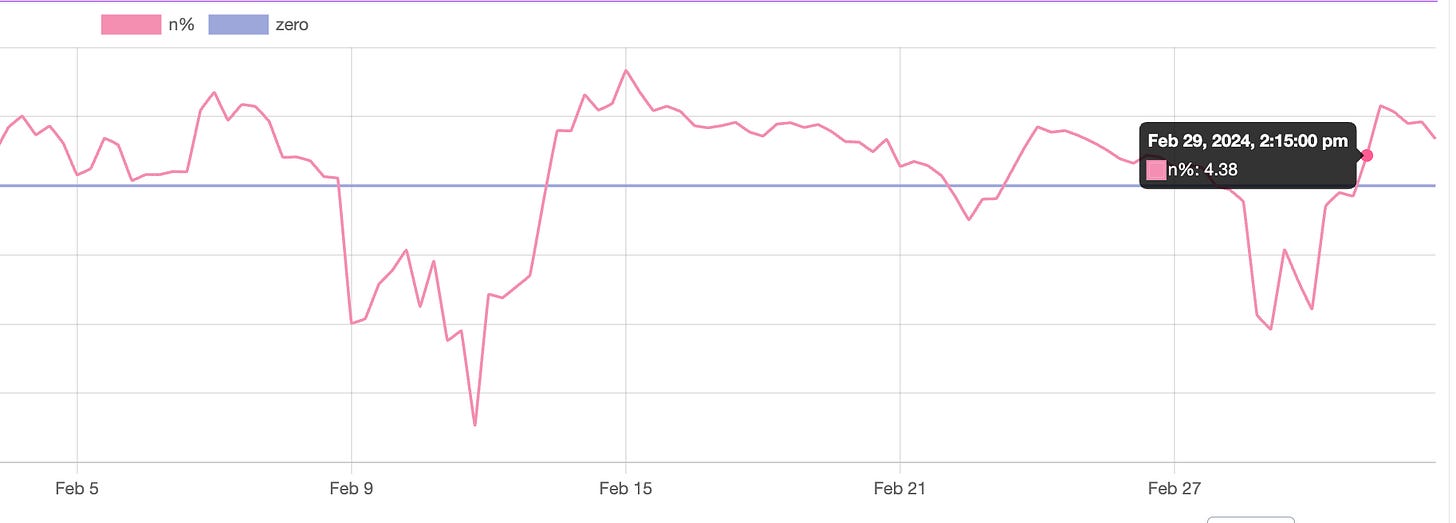
Net 4% Movers:
Turned Positive (crossed above 0) around the same time the primary breakout was signaled by the price.
Homma ORBO indicator:
Crossed ORBDs around the same time price broke out.
By the end of the day, the ORBO peak was the highest after the 14 February peak, which also by no coincidence, was a bounce day.
The Shakeout scanner: Had a very small peak
The peak was non-significant.
This can be explained as the pullback was a mild one (N500 ~2%).
And there weren’t any major shakeouts.
So is it this simple?
Of course not.
What I showed you in the article today is correlation data. 8 out of 10 times, 2 out of the 3 signals will be present when the bounce occurs.
These signals should be used only as confirmation with the primary signal i.e. PRICE.
Now,
Just because we have a bounce, doesn’t mean that we are going to get a strong up move with a 100% probability.
The broader market structure needs to be factored in at all times.
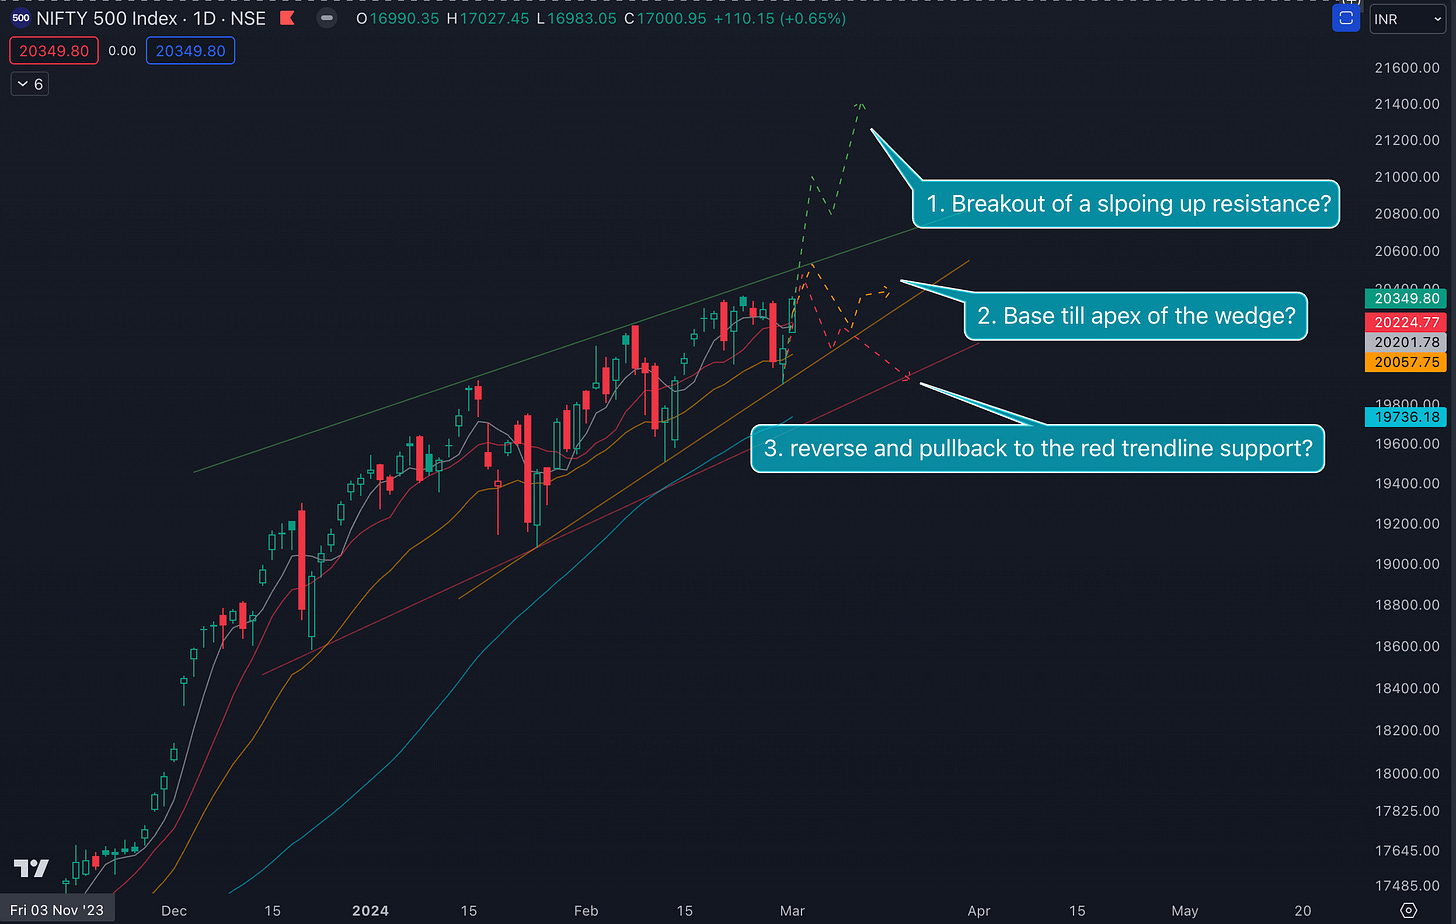
The broader indices are trending up, albeit inside a wedge.
Ascending wedges are bearish (what! Why? How? I will someday explain this in a separate article).
There are 3 possibilities now:
Bounce materializes into a strong upmove giving a BOB (Bullish on Bullish) breakout.
Price rejects the resistance and continues inside the wedge to its apex.
Price rejects the resistance and undergoes another pullback which opens up a high possibility of a breakdown from the bearish wedge.
What’s gonna happen?
Nobody knows.
My Plan:
As a price action trader, I do have certain non-zero probabilities associated with the above 3 outcomes.
But I will not act without waiting for confirmation. I will react after.
At this point. I am treading light. All my positions are for the short term.
I am looking to derisk at the first opportunity I get.
I will risk more only if I see more evidence of the up move coming.
I will get out if we break down.
I keep it simple.
I try my best to follow the plan.
What are the breadth signals I will be looking to confirm the bullish move?
Will discuss it some other day.
Too much breadth data for today.
Find the Timing dashboard below.
I discuss in the Video on HPA weekly:
Market inside a bearish wedge: 3 possibilities
Bearish divergence
How to time the bounce?
Homma anticipation and Trade plan.
The HPA folks and I are having a great time with 25-HTFs with Homma season 2.
I hope to do one soon on situational awareness and Market anticipations.
Situational awareness prepares you for all possible outcomes in the markets. This leads to low stress in trading which is a high-stress business.
But before you get there, your basic fundamental understanding of the technical price action is non-negotiable. If you need help with it, Sakatas Homma provides you with the best-in-class learning.
For Absolute Beginners: The Sakatas Homma TA Masterclass
A monster course 8-10 hours. Hourly sessions on weekends. Twice a year.
Please register for the next batch using this link.
Watch my 1st session of the Autumn 2023 batch for FREE.
(Recordings of Masterclass 4 are available for 10K.
UPI payment & WhatsApp @ 9481506784)
For intermediate traders/investors: Homma Private Access membership:
HPA is a subscription-based educational service (on WhatsApp). Benefits include:
Daily Market Breadth, Momentum, Sector Rotation, and Relative Strength Update.
Access to all my scanners including the BBB (buy before breakouts) scanner.
Access to my breadth-Momentum-Relative Strength & Sector Rotation dashboards.
Access to my Trading view indicators: Homma Khela Hobe, Buy before Breakouts (BBB), Homma Endgame
Access to live Telegram alerts to Homma Khela Hobe signal.
HPA Weekly: Hourly weekend deep dives and Q&A.
1-year access to The Technical Take premium.
Live updates on my portfolio and the trading setup rationale.
Access to my high probability watchlist.
Yearly membership of 15000/- INR only.
UPI payment & WhatsApp @ 9481506784.
Yours
Sakatas “times the bounce” Homma.


