Support confirmation signals
and how to use them to anticipate a peak pullback/reversal.
There is a thin line between bravery & stupidity. Very thin
Hello mate,
Do you buy pullbacks? Are they hard for you psychologically? Is there more fear in buying Pullbacks as compared to buying Breakouts?
Let me tell you this much. Buying pullback is a higher-level skill IMO. It is more rewarding but requires a certain level of skill and conviction especially when you are a beginner.
But buying every pullback would be stupid and not brave. Today, I am going to discuss that one thing that will improve the odds of a Pullback trade.
“CONFLUENCE” of supports.
If you want to have a higher success rate for your pullback trades, look for one or more of the following supports:
AVWAP from the previous pivots.
Volume profile high.
Supertrend support.
Key MA support.
Previous Pivot high turned Resistance support.
key Fibonacci levels.
Lower/Middle Bollinger band.
Reversal Candles: Stop Volume, Hammers
Gap Boundaries.
PS: consolidation (at least on a lower timeframe)
Let’s look at them one by one. (It’s a long read, please read till the end)
1. AVWAP from the previous pivots:
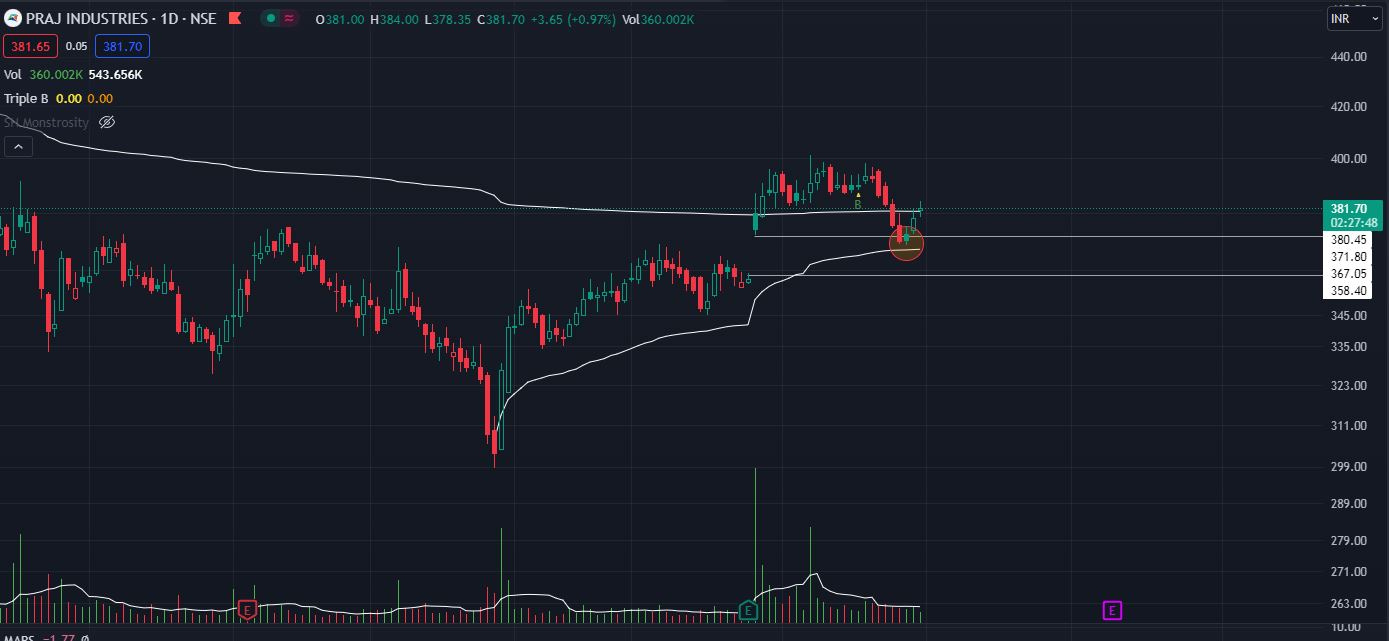
An AVWAP anchored from the previous swing high and/or previous swing low or any important pivot such as a Gap boundary or the breakout candle can act as excellent support.
Praj Industries: AVWAP from previous swing lows as support
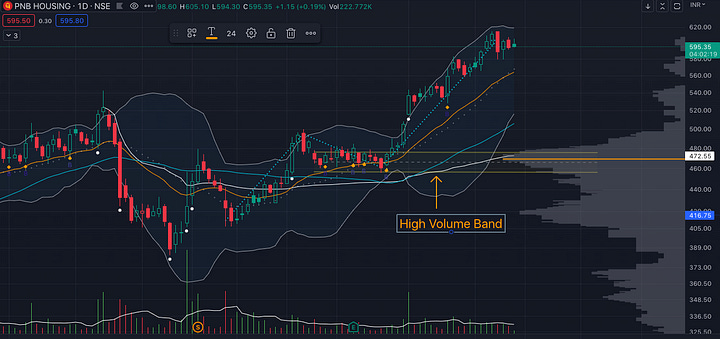
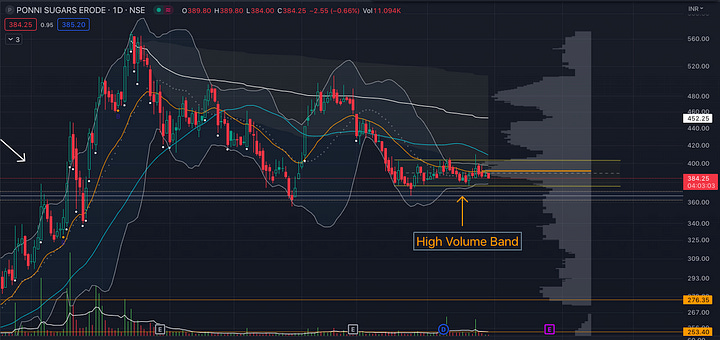
2. Volume profile high:
Volume profile (right-most histogram in the examples below) is a tool that shows you the Total volumes that have been traded at a particular price point for the last N period. The highest price point of this histogram often is a highly contested zone. They act as strong support and resistance.
3. Supertrend support:
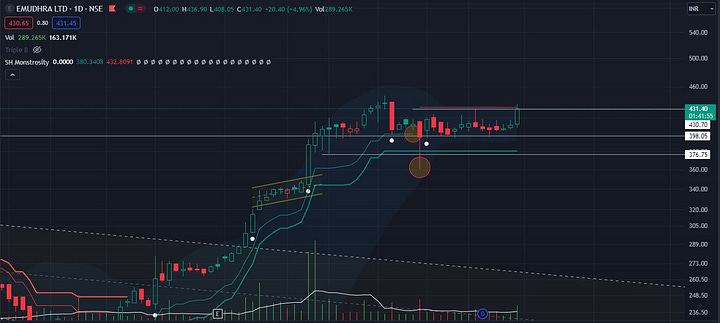
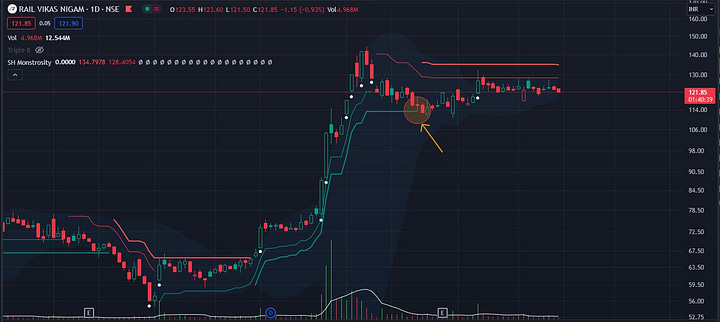
A good trend-following indicator. It is constructed by using the volatility (ATR) of the stock. Prices often bounce back from the key ST levels in a trending stock.
The default setting is 7/3.
My favorite is 10/3 and 10/2.
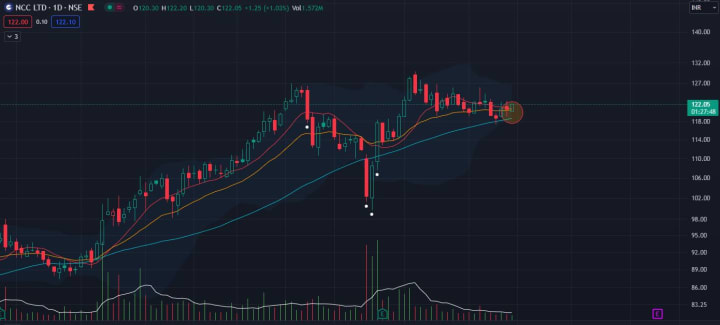
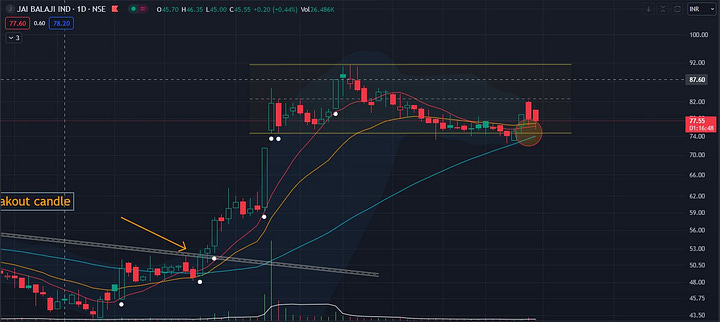
4. Key MA support:
this one is easy and widely used. Price takes support and bounces back from key MAs i.e. 10SMA, 21EMA, 50SMA, etc.
When all of these line up together below the Price, it acts as even stronger support.
This is also a tradable set-up that many traders use. Ace trader and mentor Ray from Traderlion call it a Launchpad setup.
5. key Fibonacci levels:
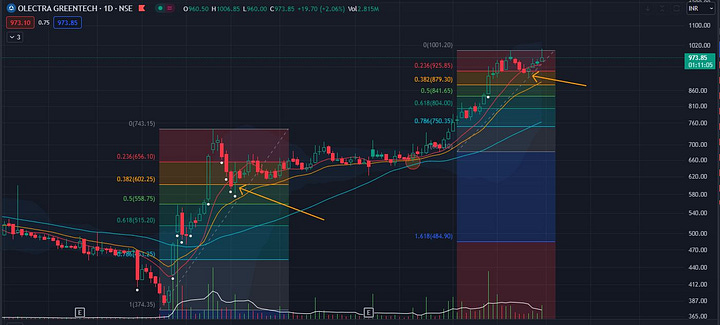
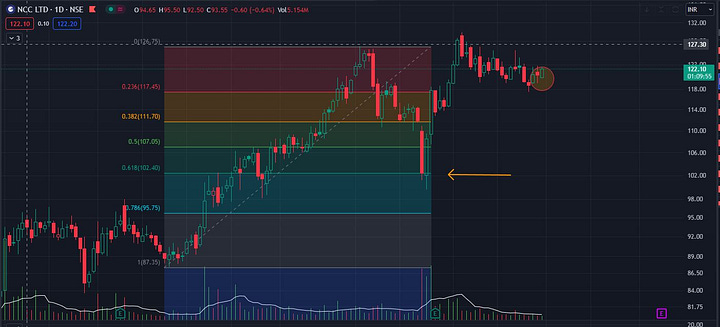
After a big move or a considerable move when the price corrects, key Fibonacci levels viz 23.6%, 38.2%, 50%, 61.8%, and 78.6% are levels that can act as supports.
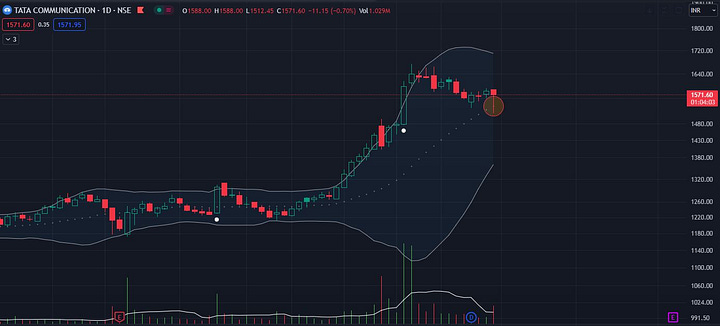
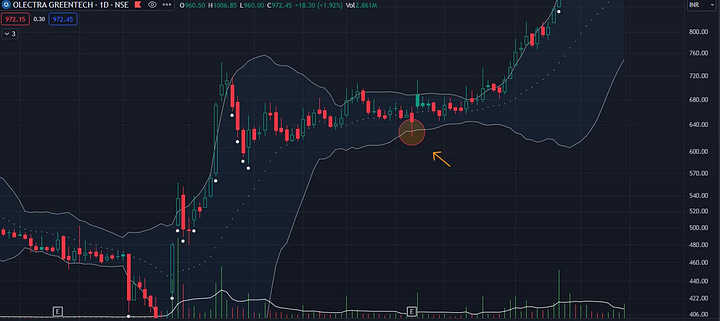
7. Lower/Middle Bollinger band:
Another excellent indicator, the Lower & Middle Bollinger bands often act as a support for reversal.
8. Reversal Candles:
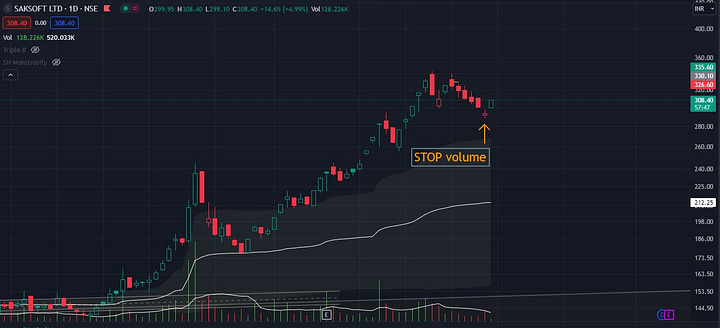
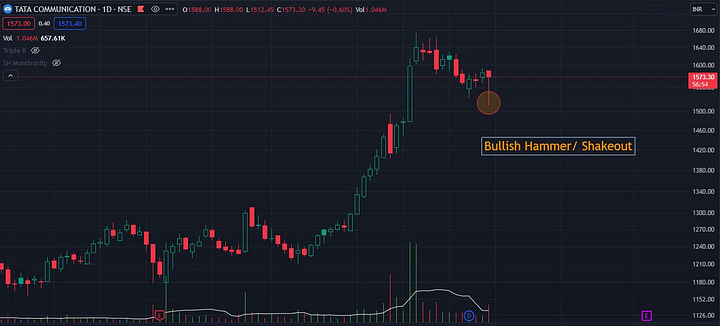
Look for reversal candlestick patterns such as:
Hammers
Stop Volumes
Bullish Tweezers
Morning Stars etc.
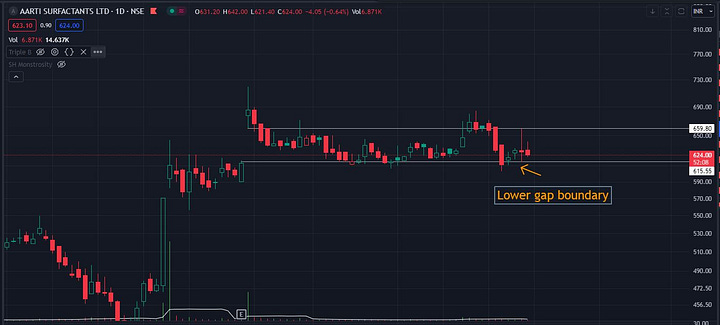
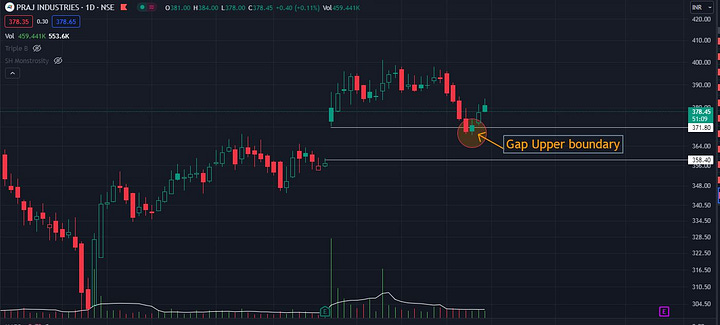
9. Gap Boundaries:
Gap Boundaries are another excellent area for price to take support. This can also be used as a set-up. the HV type3 entry is exactly this.
Summary:
By now you have got an idea of the various tools you can use to anticipate a good support area and why multiple confluence increases the probability of a setup.
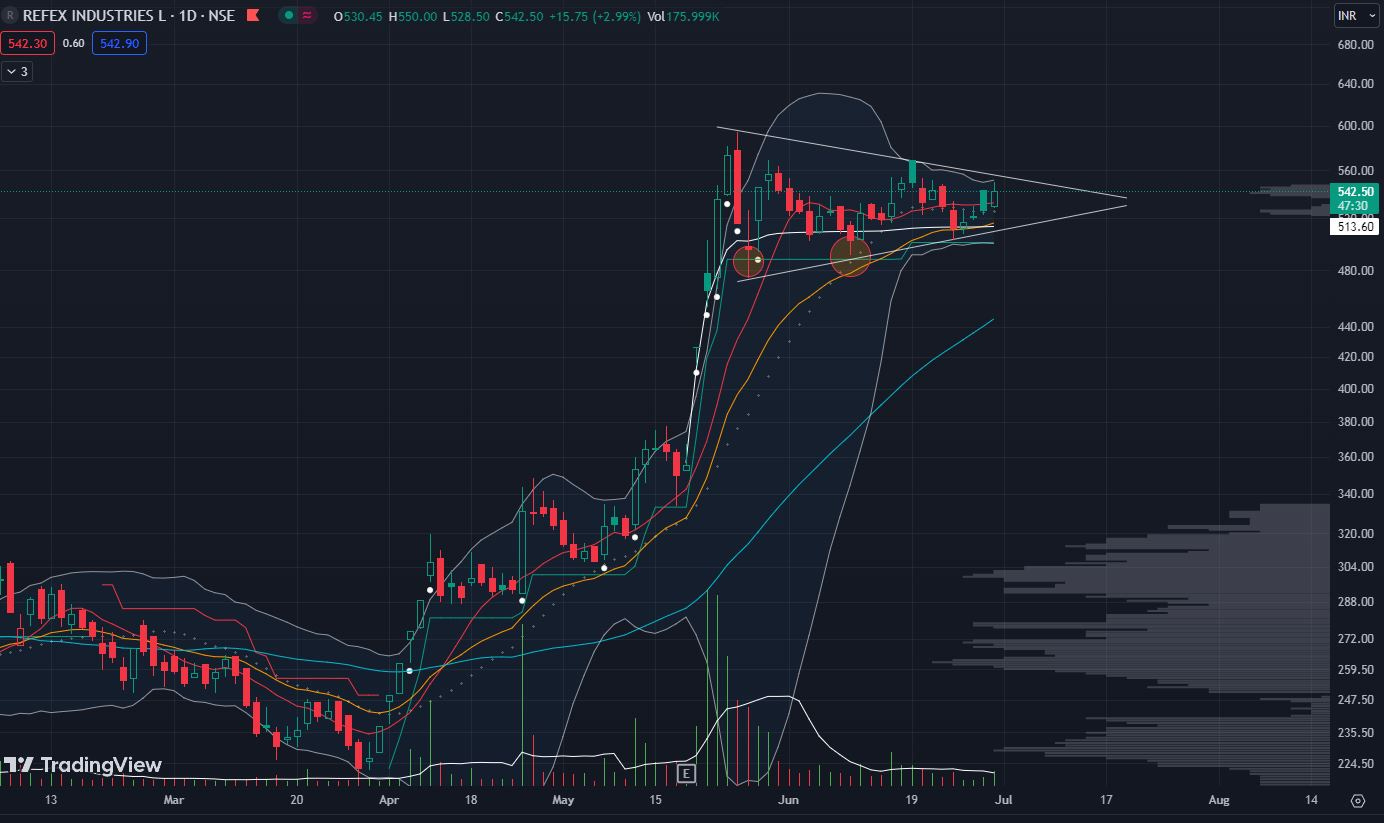
Summing it up, here is an example.
REFEX: At a confluence of supports
If you are a beginner trader, struggling to be consistently profitable.
Sakatas Homma can help you level up in the following 2 ways below:
The Sakatas Homma TA masterclass for beginners:
A monster course (12-15 hours total). Hourly sessions on weekends. Twice a year.
Please register for the fall 2023 course (September 2023) using the link below.
https://docs.google.com/forms/d/e/1FAIpQLScfnQA1w9WDTtTAPEHIqzkS9jhRSZFA1BZXuWRZ5JPZ3Qfu8g/viewform
Watch my 1st session of the spring 2023 batch.
Homma Private Access membership:
HPA is a subscription-based educational service (on WhatsApp). Benefits include:
Daily Market Breadth Update.
Access to my scanners and dashboards and charting layouts.
Weekend hourly session and Q&A.
Live updates on my portfolio and the trading setup rationale.
Live updates of key setups I am tracking.
Yearly membership of 6000/- INR only.
UPI payment & WhatsApp @ 9481506784.
This is all for this weekend,
I will see you in the next one. Till then,
Don’t stop asking those stupid questions.
~ Homma
Some Peak Scanners for you:
Pullback to 10/21 ma: https://chartink.com/screener/copy-shpb1021
VCP (long-term timeframe): https://chartink.com/screener/shvcp-epic-modified
sector rotation/ Relative strength dashboard:
https://chartink.com/dashboard/177929


Amazing article detailing all signals to look for.