


Market MATH & Watchlist: 8-Feb-2025
Bias: Neutral to Bullish

MATH: Momentum Anticipation and Trend by Homma:
MATH last week: Click the link
The most comprehensive article on Breadth and Anticipation:

As technical traders, We
“Anticipate, but confirm. Wish, but only react.”
Trend:
Short-term: “Percentage of stocks above 10-DMA”
Medium-term: “Percentage of stocks above 50-DMA”
Long-term: “Percentage of stocks above 200-DMA”
The short-term trend is now above the bullish level for a week.
While the medium and Long-term trend is still bearish and trending down.

Momentum:
The Mswing score and Landry Score.
Homma Mswing Score: It has continued to trend up this week.
Landry Daily: (Momentum Bias for Swing Play)
While the Landry plot also trended up the entire week, it printed a lower value on the week’s close. This could mean the start of a downswing in momentum.
Landry Weekly (Momentum Bias for Positional Play):
Still trending down.
For an easy-money environment to sustain for positional trading, this plot needs to start trending upward.
INDICES:
N50:
The countertrend bounce found the DTL line and the 50-DMA resistance. Price is currently pulled back to the 10/20 MA which could act as a potential support.

N500:
Weaker than the N50, the countertrend bounce found resistance at the previous high. Still on a downtrend, but looks like a base under construction.

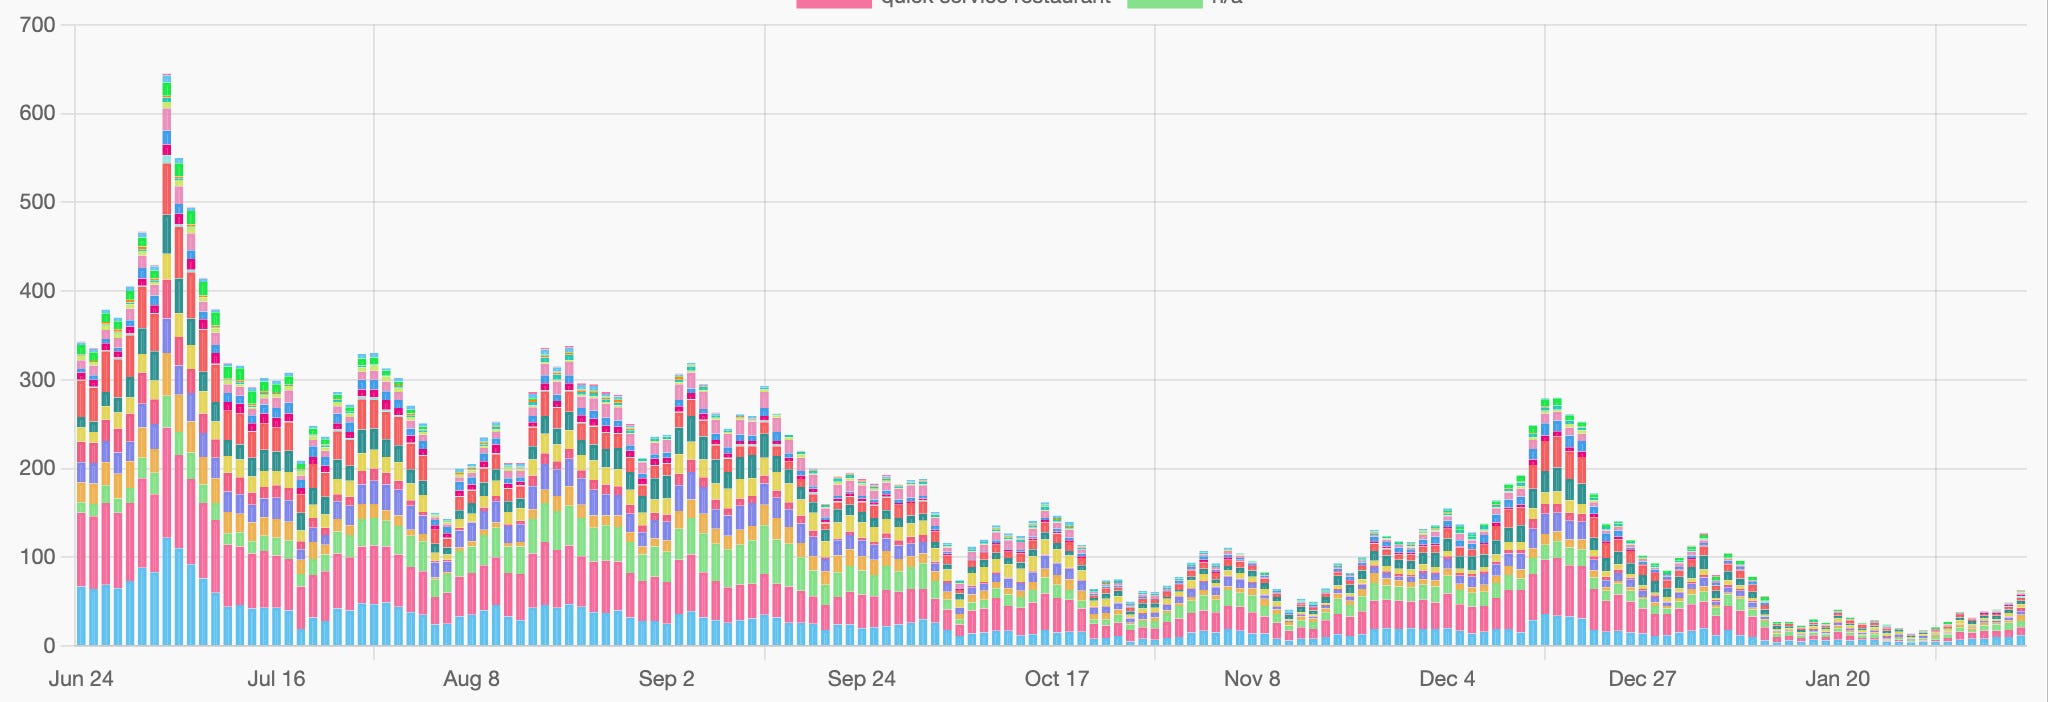
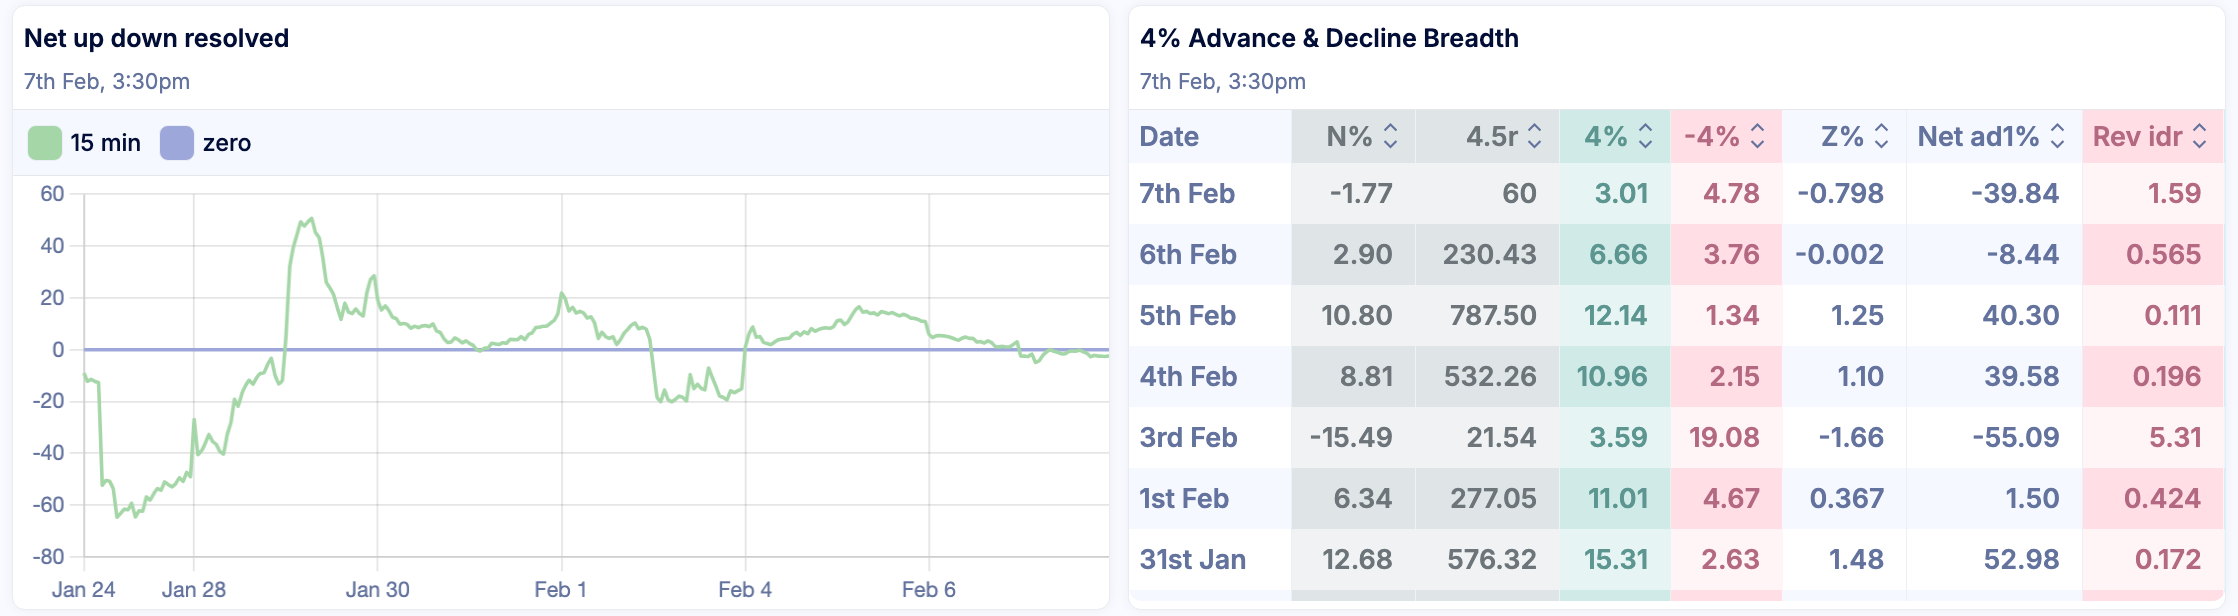
Net4% Movers:
Mixed week. No clear strength and no clear weakness.
Anticipation:
This counter-trend bounce which started as an oversold rally on 29th Jan is still On.
It has been punctuated by minor pullbacks and currently, the MidSmall400 sits on the 10-DMA with the 20DMA on top.
Friday although was a bearish day, the bulls pegged it back at the later part of the day. So this is a good sign.
My bias changed from “Neutral to bearish” to “Neutral to bullish” once we crossed the 10-DMA. It will remain as long as it maintains that structure.
The overall structure is still that of a Lower-high Lower-low.
Positionally therefore is a NO Money whatsoever.
For swing trading, this is a hard money environment, as we are on a countertrend bounce, but this can reverse in a heartbeat.
Below the 10-DMA, we go back to a No Money for swing trading again.
And if that happens we wait for a bottom to play the bounce again.
If this bottom is found at the previous low, a slight undercut or higher; that would be a good sign for this level to be a medium-term bottom.
So, we wait and play accordingly.
I anticipate a continuation of the counter-trend bounce upwards with extreme chop and volatility. Maybe challenge the 50-DMA.

PS: Anticipations are often wrong and bias should be adjusted with every candle.
If you dont know this already, I update my Market MATH every day on my website under the BREADTH section. Please check in every day post-market.
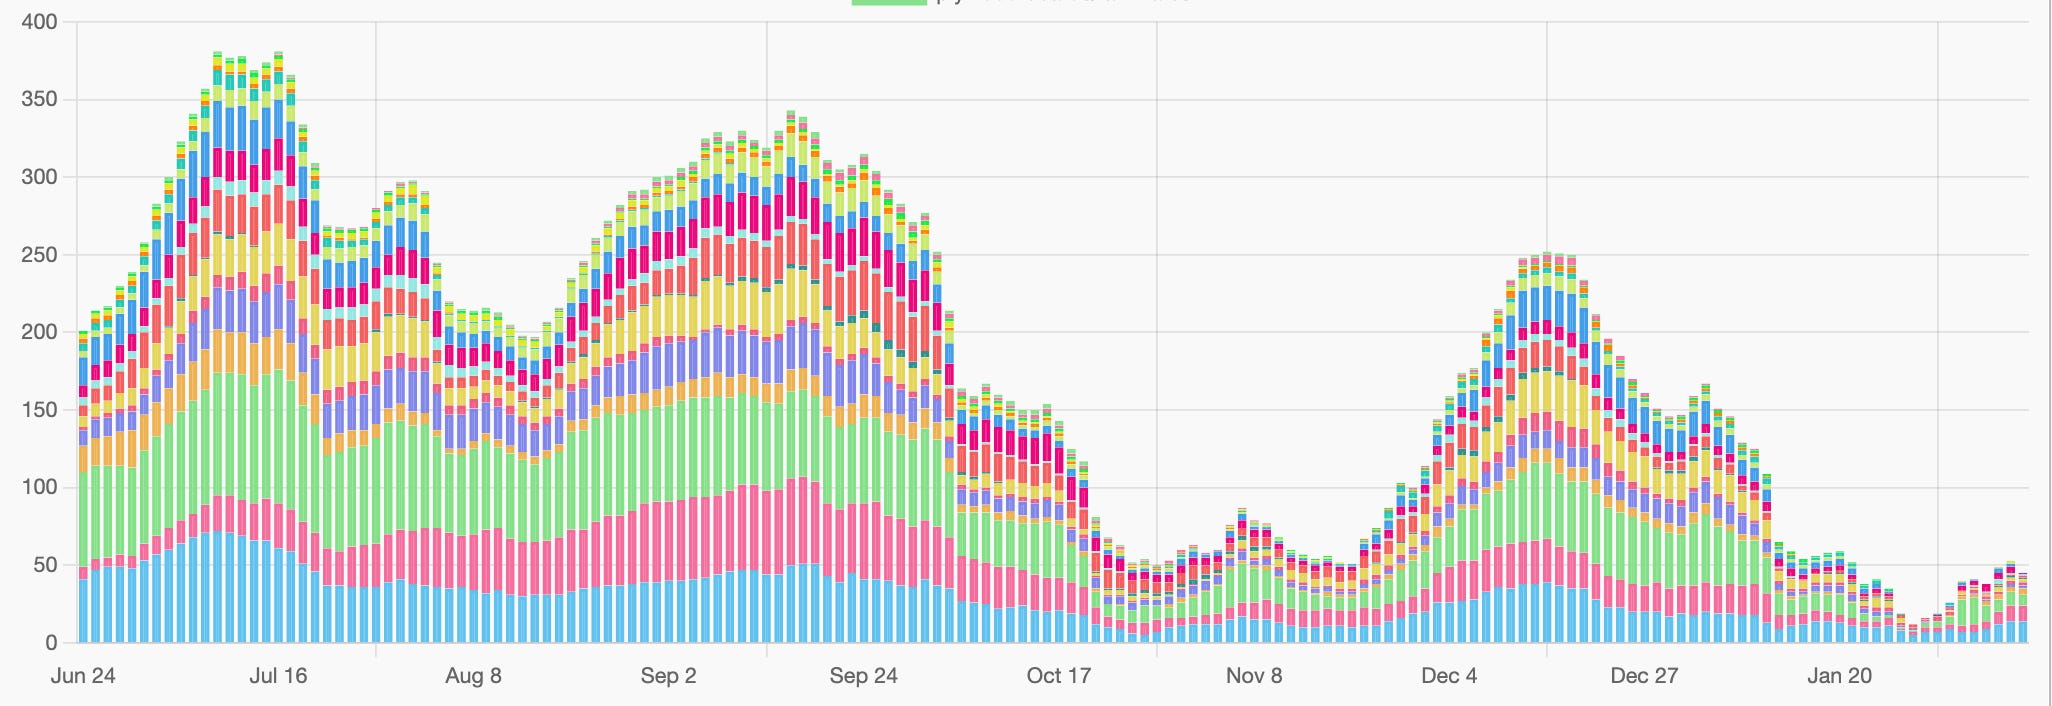
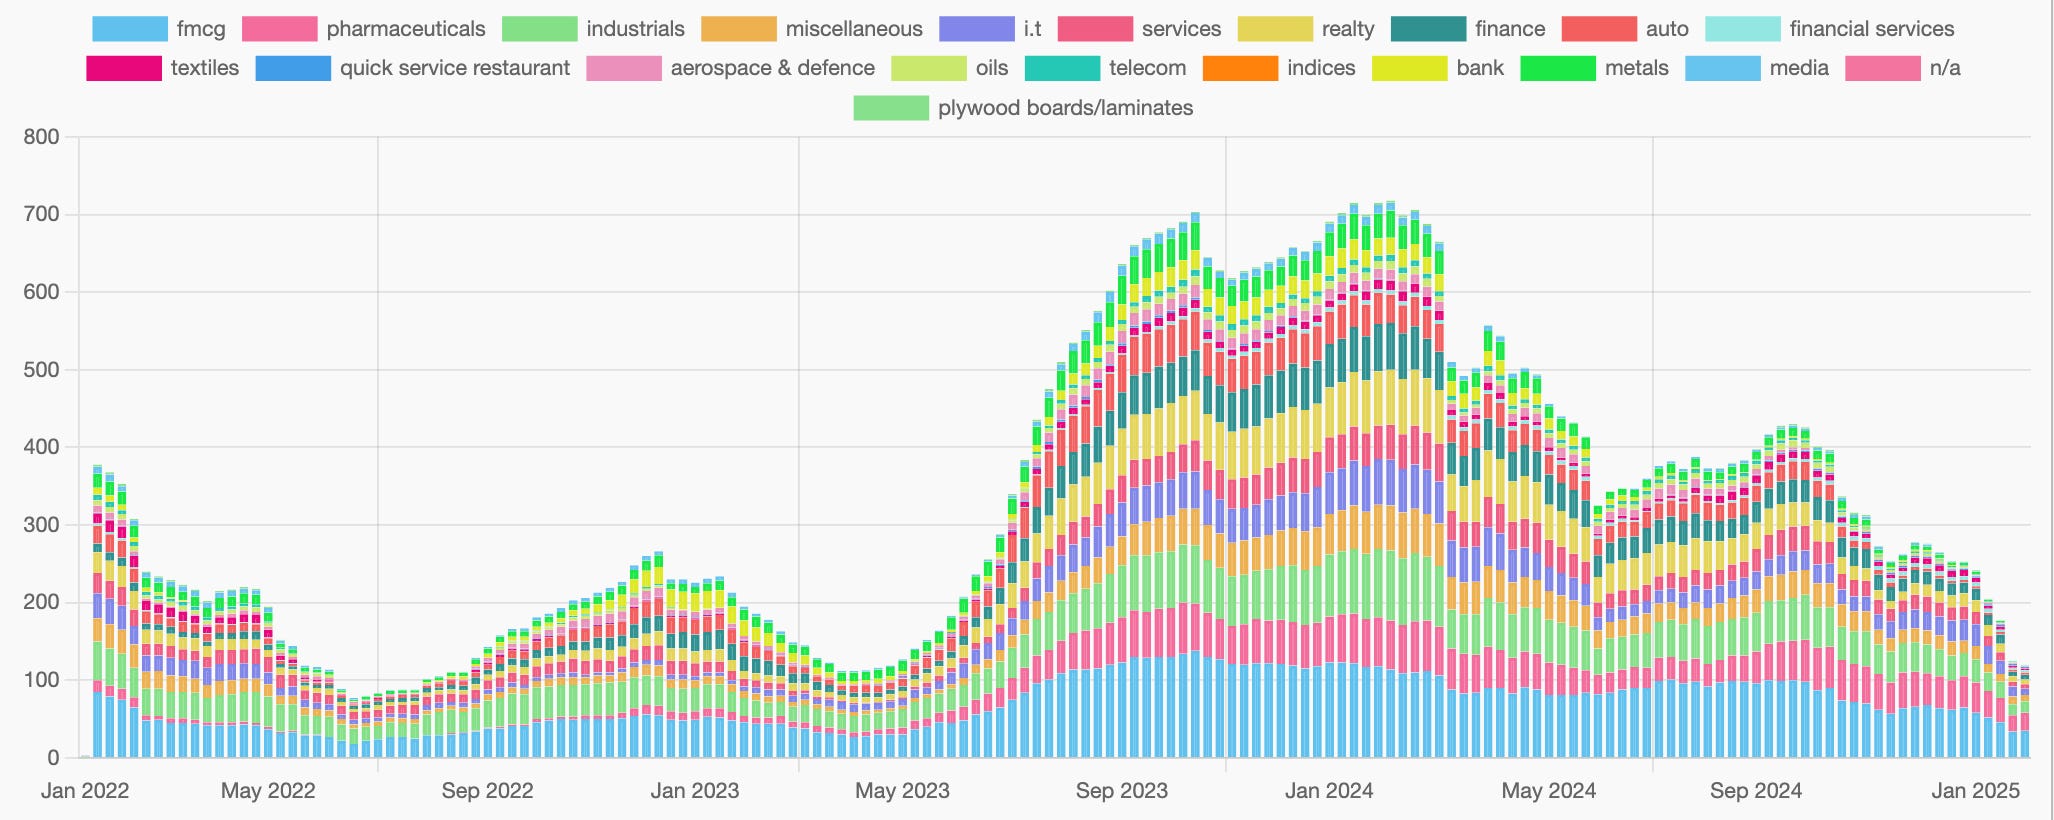
Group Strength:
The strongest groups:
Index: Pharma-Health-IT-Pvt Banks looking good.
Groups:
It is difficult to put a pin on a specific group while the market is bearish. Best to take a bottoms-up approach by looking at individual stocks from the relative strength list.
PS: keep a tab on “Big Base Breakouts”. Those who break out for these will likely be the leaders when the Markets reverse. Eg: SRF, Kotak Bank, Jindrill, etc
Watchlists:
Follow the Strongest Stock (the RS 100 names):
Intraday tradable names would be found on the Strong Start candidates every day:
https://www.sakatashomma.com/scanners
Watchlist(s) below
Keep reading with a 7-day free trial
Subscribe to The Technical Take to keep reading this post and get 7 days of free access to the full post archives.