


Market MATH & Watchlist: 2-Feb-2025
Bias: Neutral to Bearish

MATH: Momentum Anticipation and Trend by Homma:
MATH last week: Click the link
The most comprehensive article on Breadth and Anticipation:

As technical traders, We
“Anticipate, but confirm. Wish, but only react.”
Trend:
Short-term: “Percentage of stocks above 10-DMA”
Medium-term: “Percentage of stocks above 50-DMA”
Long-term: “Percentage of stocks above 200-DMA”
The short-term trend is now above the bullish level.
While the medium and Long-term trend is still bearish and trending down.

Momentum:
The Mswing score and Landry Score.
Both plots have reversed and started to trend back up from the absolute pit of the bottoms.
Landry:

N50:
bounced from the AVWAP from October 2023 lows.
It is a counter-trend bounce, still on a downtrend and still below the key medium-term 50DMA.

N500:
Very similar to N50. It's still on a downtrend.

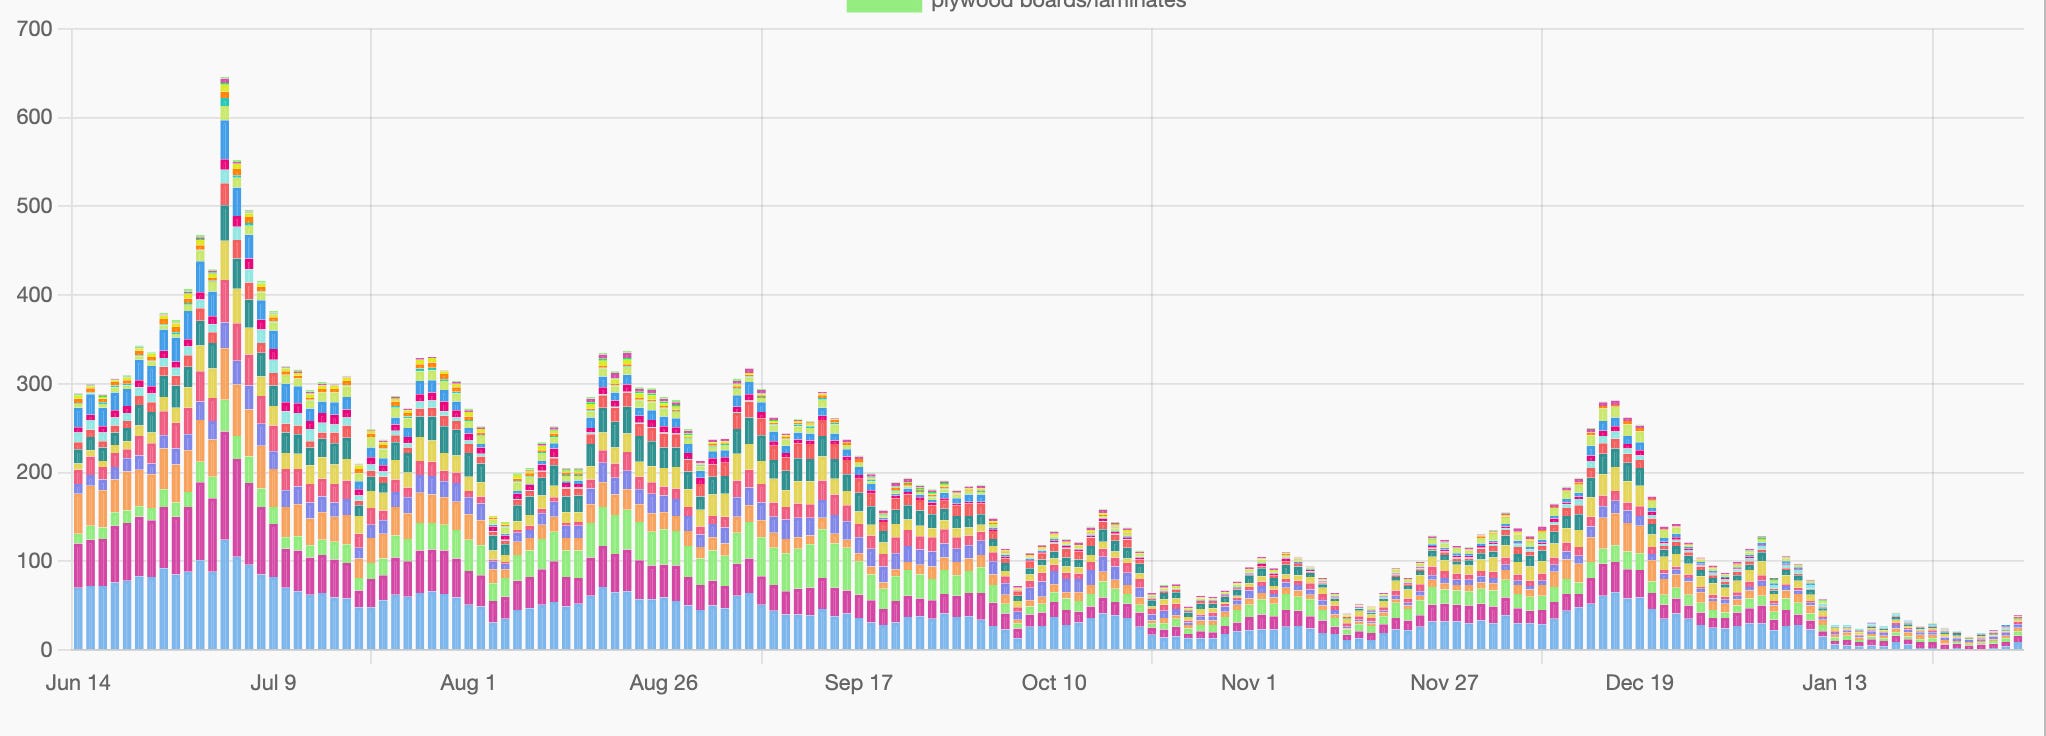
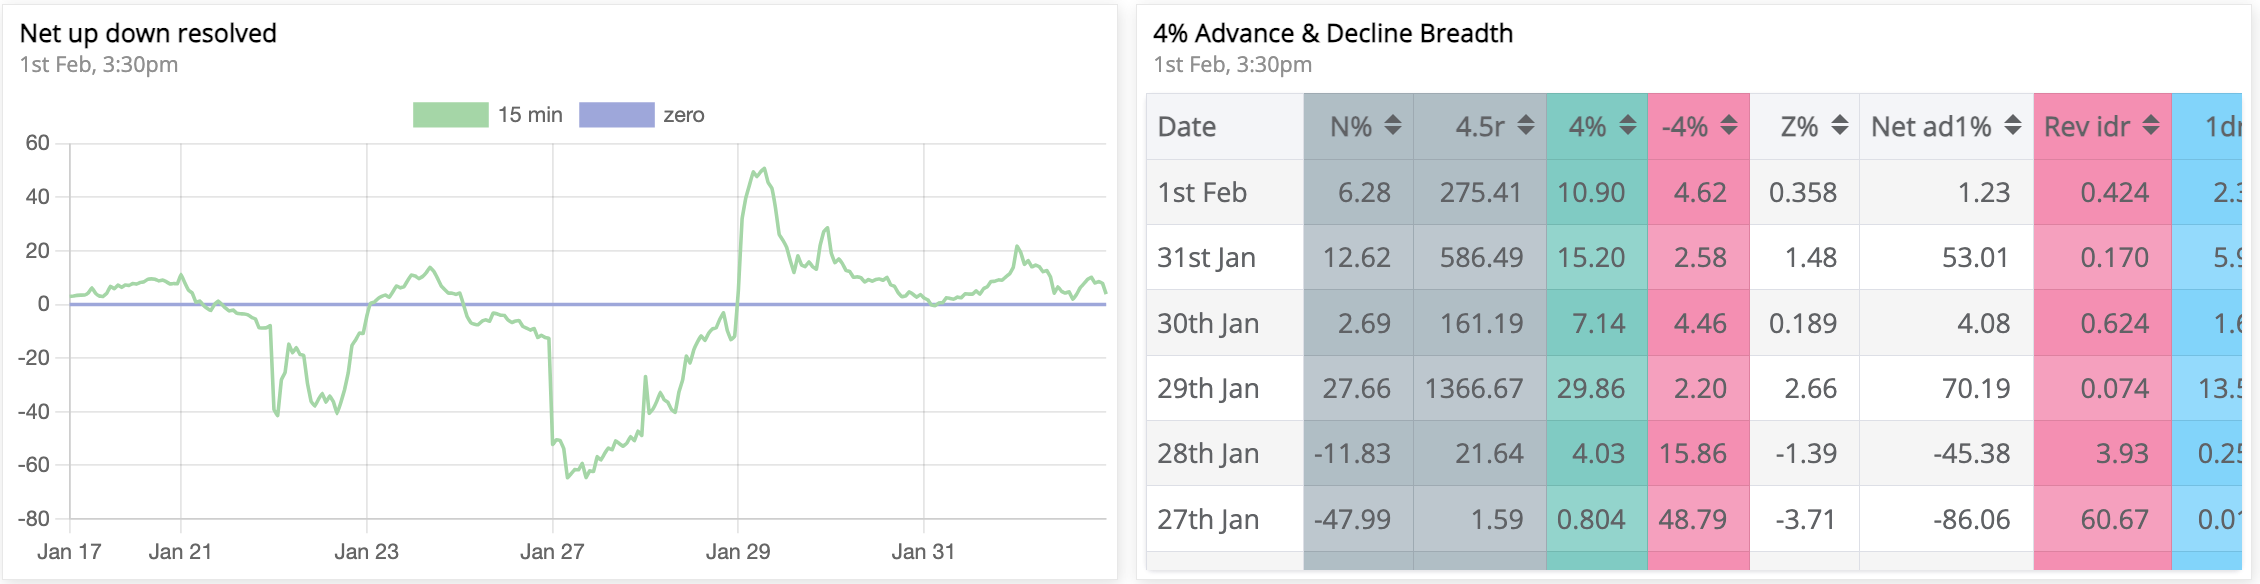
Net4% Movers:
After getting oversold 2 days on the opening days of the week we saw Big bullish pressure on the 29th which has been tapering off.
Anticipation:
The last oversold rally was cut short by a slap from the 10DMA.
This one is currently 4 days old and nearing the 20-DMA.
We still do not have a pivot high, which opens up the possibility that this rally could extended further and perhaps challenge the 50-DMA. This will have a higher high (HH) and the probability of a reversal in the short-medium term will increase.
Having said that, the current high is still a lower high, and as such this is a countertrend bounce in a downtrend. If we get a pivot high that is lower than the previous high, the bias of a downtrend will continue.
Therefore my bias remains bearish to neutral. This could change very quickly (follow my daily update on sakatashomma.com every day to keep updated).

PS: Anticipations are often wrong and bias should be adjusted with every candle.
If you dont know this already, I update my Market MATH every day on my website under the BREADTH section. Please check in every day post-market.
Group Strength:
The strongest groups:
Index: FMCG-consumption-Auto-Banks
Groups:
It is difficult to put a pin on a specific group while the market is bearish. Best to take a bottoms-up approach by looking at individual stocks from the relative strength list.
Watchlists:
Follow the Strongest Stock (the RS 100 names):
Intraday tradable names would be found on the Strong Start candidates every day:
https://www.sakatashomma.com/scanners
Watchlist(s) below
Keep reading with a 7-day free trial
Subscribe to The Technical Take to keep reading this post and get 7 days of free access to the full post archives.