


Market MATH & Watchlist: 7-March-2025
Bias: Poised. Open to both continuation and Reversal

MATH: Momentum Anticipation and Trend by Homma:
MATH last week: Click the link
The most comprehensive article on Breadth and Anticipation:

As technical traders, we
“Anticipate, but confirm. Wish, but only react.”
Trend:
Short-term: “Percentage of stocks above 10/20-DMA”
Medium-term: “Percentage of stocks above 50-DMA”
Long-term: “Percentage of stocks above 200-DMA”
Downtrending medium and long-term.
Trending up short-term.
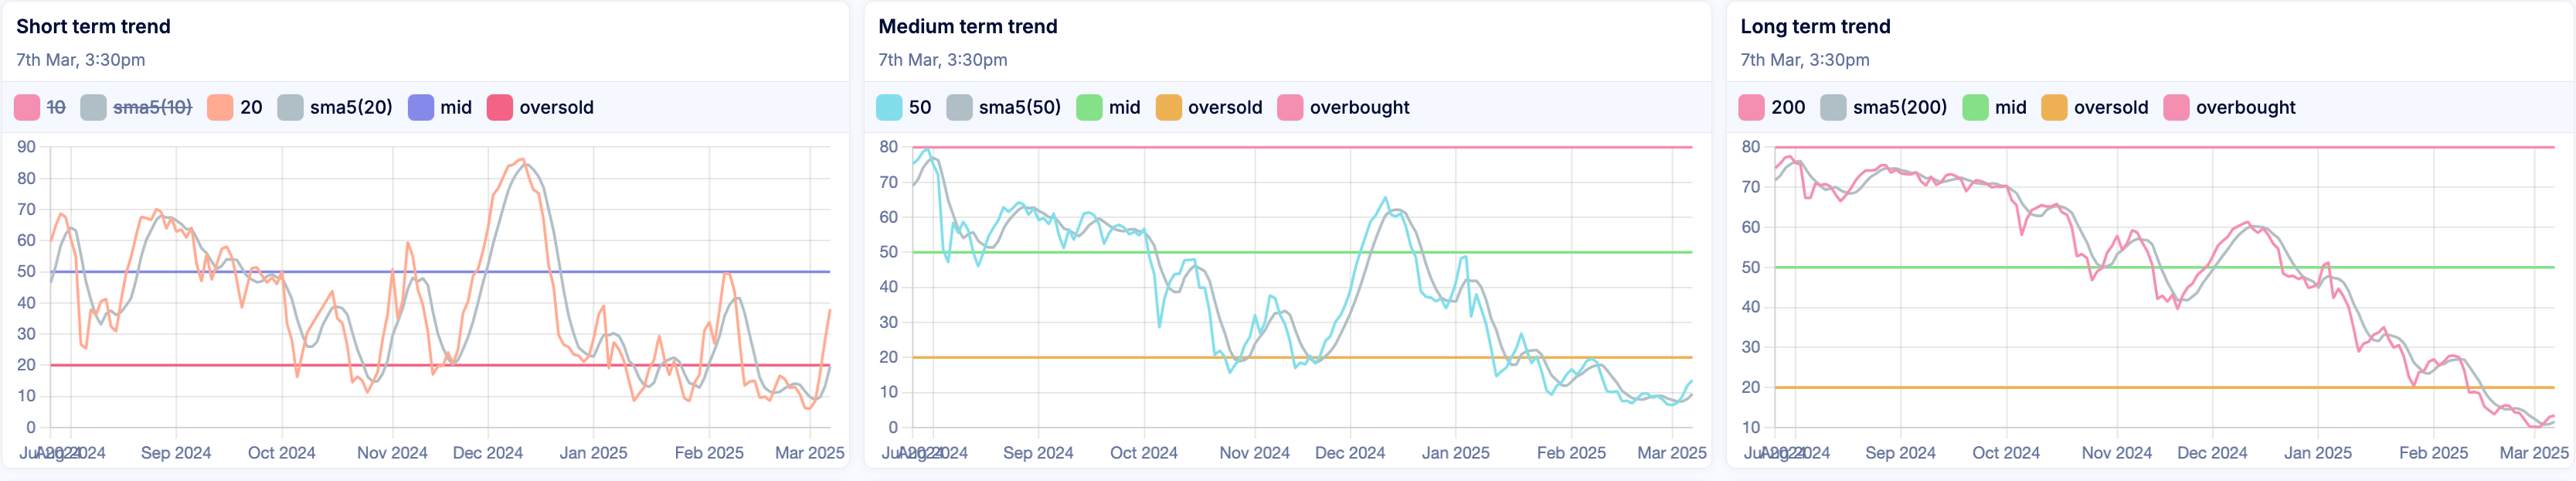
.
Momentum:
Still making lower highs.

Landry Daily: (Momentum Bias for Swing Play)
Spikes.
Improving.
Trending up 4th day in a row.

.
Landry Weekly (Momentum Bias for Positional Play):
Still trending down.
This plot must start trending upward for an easy-money environment to sustain positional trading.

INDICES:
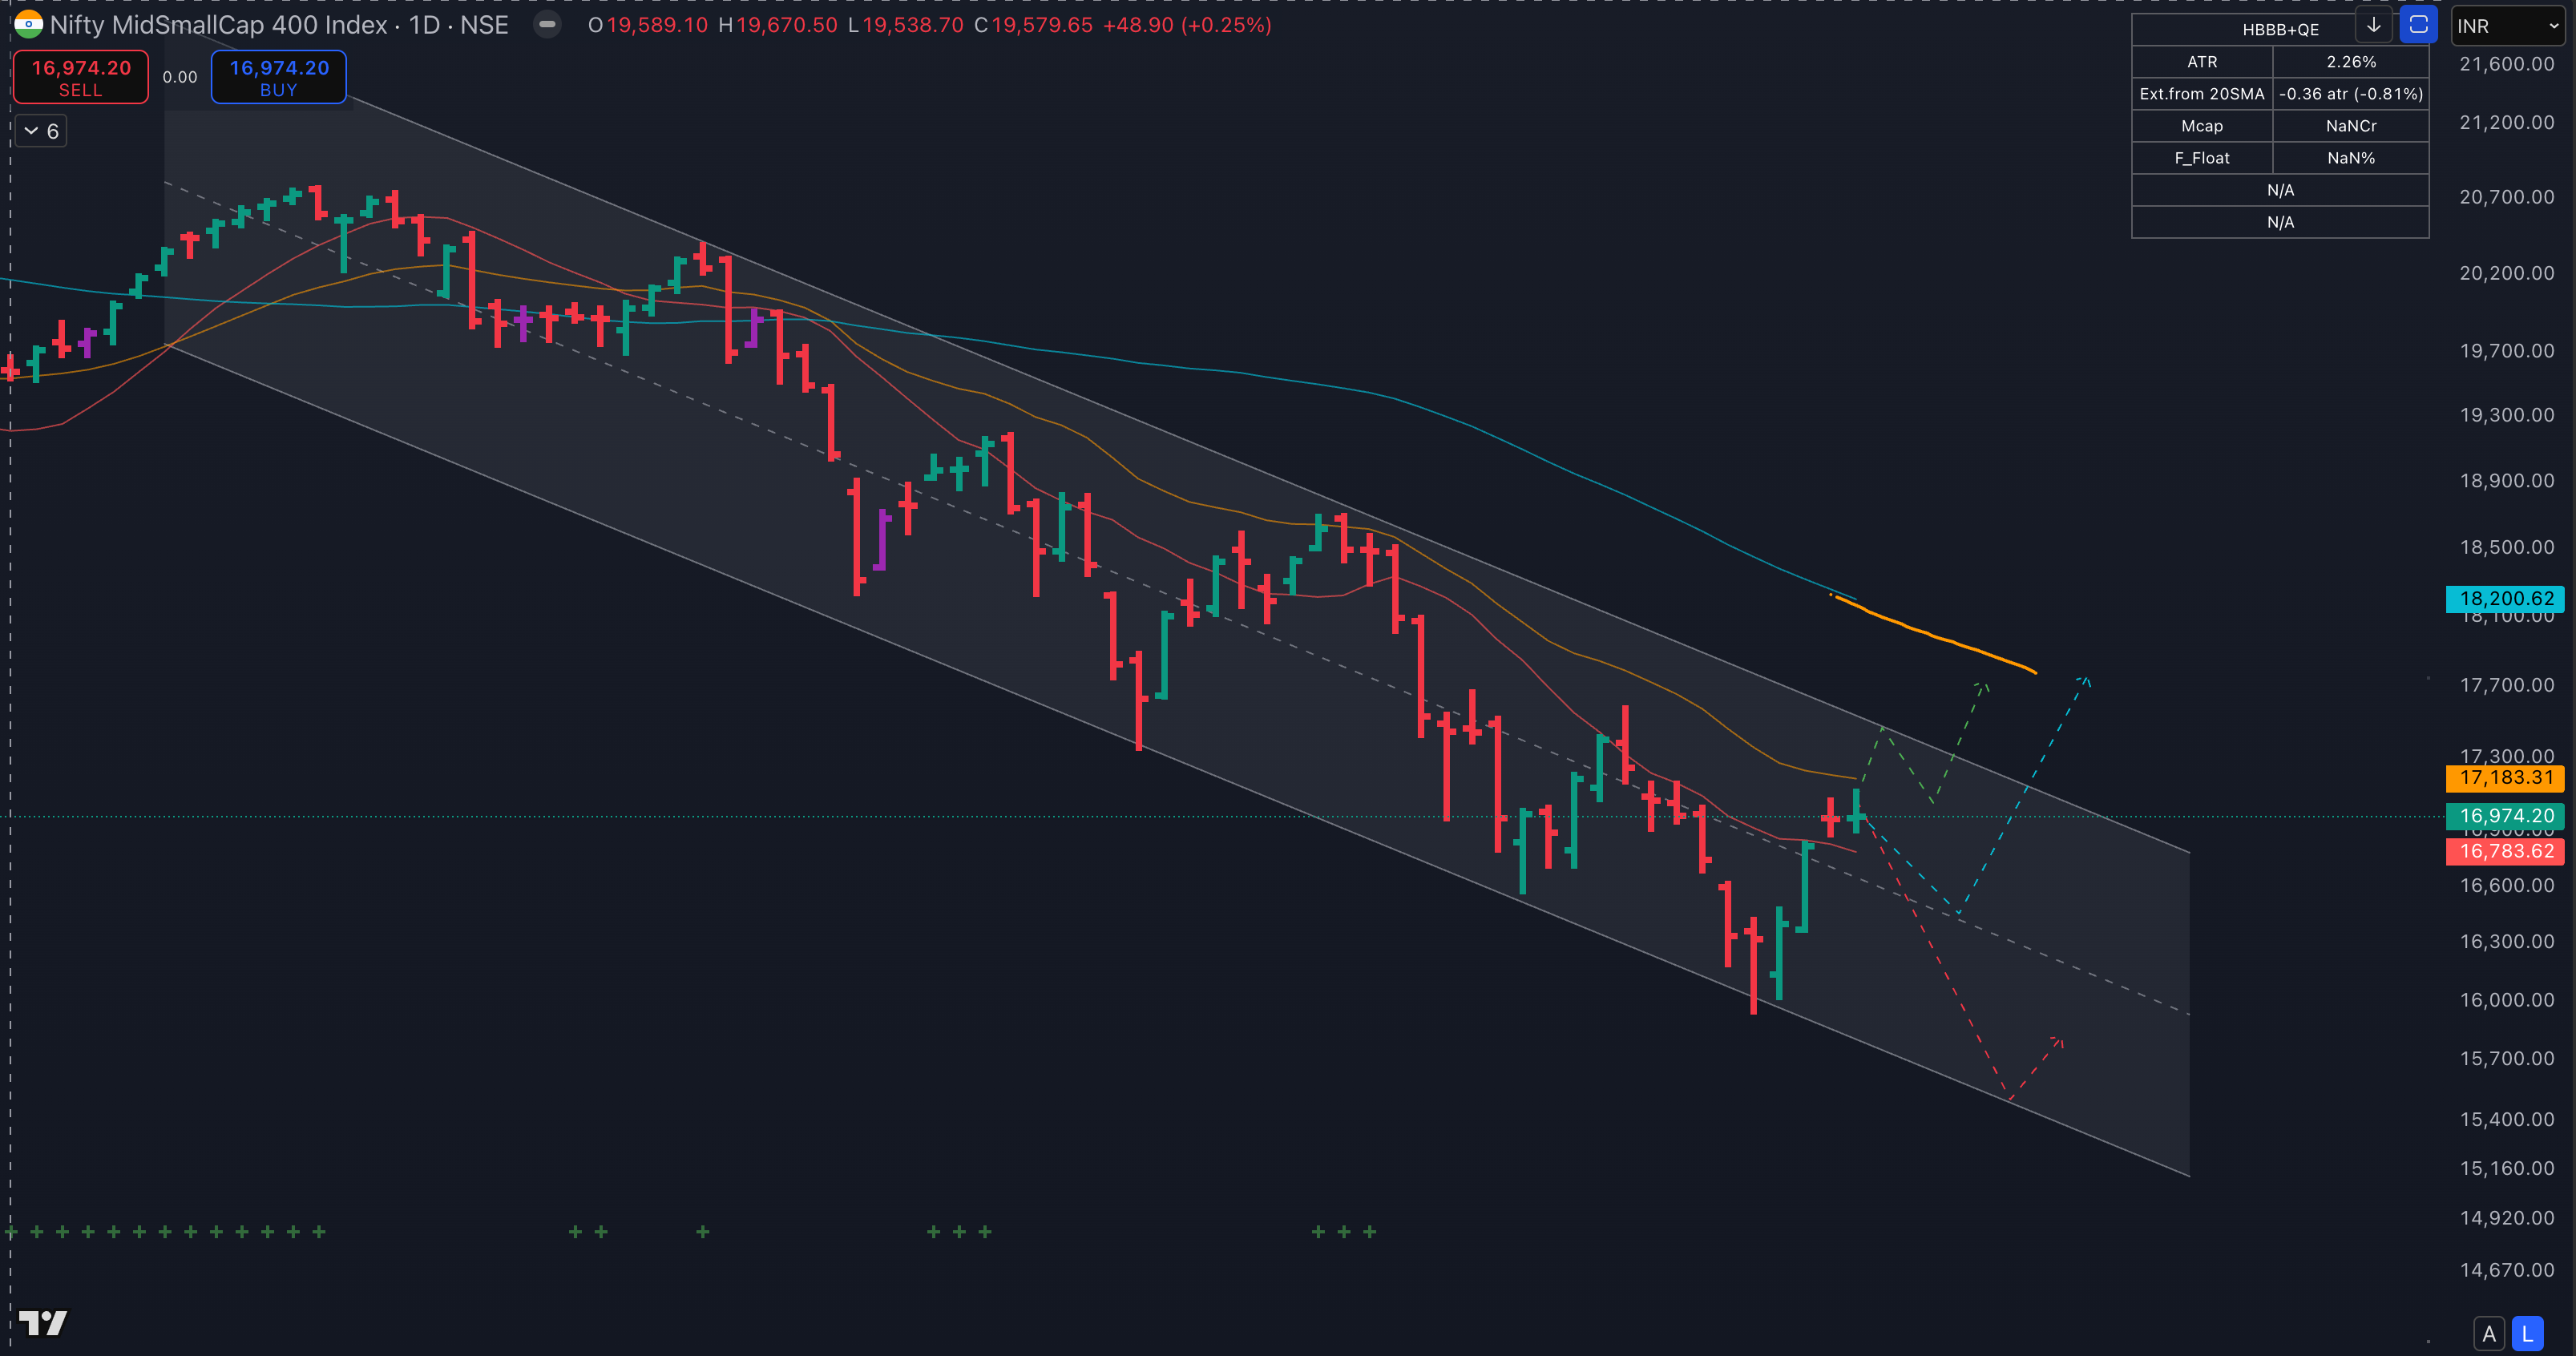
N50:
Downtrend.
Price bounced off the Avwap from 2023 March lows.
Now at a potential resistance from the key MAs, 10/20.

Net4% Movers:
Bullish numbers throughout the week after the bounce day on the 4th of March.
Bullish strength has been decreasing.

Anticipation:
So we are on the 4th day of the bounce. How could things unfold next?
We are still on a downtrend.
And at a zone of potential resistance from the declining key MAs, 10 & 20.
Above this level, the channel resistance is another potential resistance zone.
There are 3 possibilities:
We climb towards the channel top and 50DMA either immediately or after a day or two of sideways action.
We climb, but after putting a higher low in.
We get slammed and reverse, continue the downtrend.
As things stand, I dont have any reason to assign higher probabilities to either of the possibilities.
I am therefore open to all and will let the future price action guide me. Until then I will trust the bounce.
Gut feel?
We challenge the 50-DMA this time.
Still No Money for swing and positional traders.
PS: Anticipations are often wrong and bias should be adjusted with every candle.
If you dont know this already, I update my Market MATH every day on my website under the BREADTH section. Please check in every day post-market.
Group Strength:
The strongest groups:
Index: Metals
Groups:
It is difficult to put a pin on a specific group while the market is on a downtrend.
If still trading, best to take a bottoms-up approach by looking at individual stocks from the relative strength list.
Watchlists:
Follow the Strongest Stock (the RS 100 names):
Intraday tradable names would be found on the Strong Start candidates every day:
https://www.sakatashomma.com/scanners
Watchlist(s) below
Keep reading with a 7-day free trial
Subscribe to The Technical Take to keep reading this post and get 7 days of free access to the full post archives.