


Market MATH & Watchlist: 28-Feb-2025
Bias: of a countertrend bounce but not before a capitulation move.

MATH: Momentum Anticipation and Trend by Homma:
MATH last week: Click the link
The most comprehensive article on Breadth and Anticipation:

As technical traders, we
“Anticipate, but confirm. Wish, but only react.”
Trend:
Short-term: “Percentage of stocks above 10/20-DMA”
Medium-term: “Percentage of stocks above 50-DMA”
Long-term: “Percentage of stocks above 200-DMA”
Downtrending and at oversold levels in all timeframes.

.
Momentum:
There is no momentum whatsoever. Absolute pits of the bottom.
Landry Daily: (Momentum Bias for Swing Play)
Same as Mswing. Languishing at the bottom.

.
Landry Weekly (Momentum Bias for Positional Play):
Trending down.
This plot must start trending upward for an easy-money environment to sustain positional trading.
INDICES:
N50:
Downtrend.
The channel midline is broken to the downside.
Price could hurry toward the channel support or around the vwap anchored to the March 2023 lows.

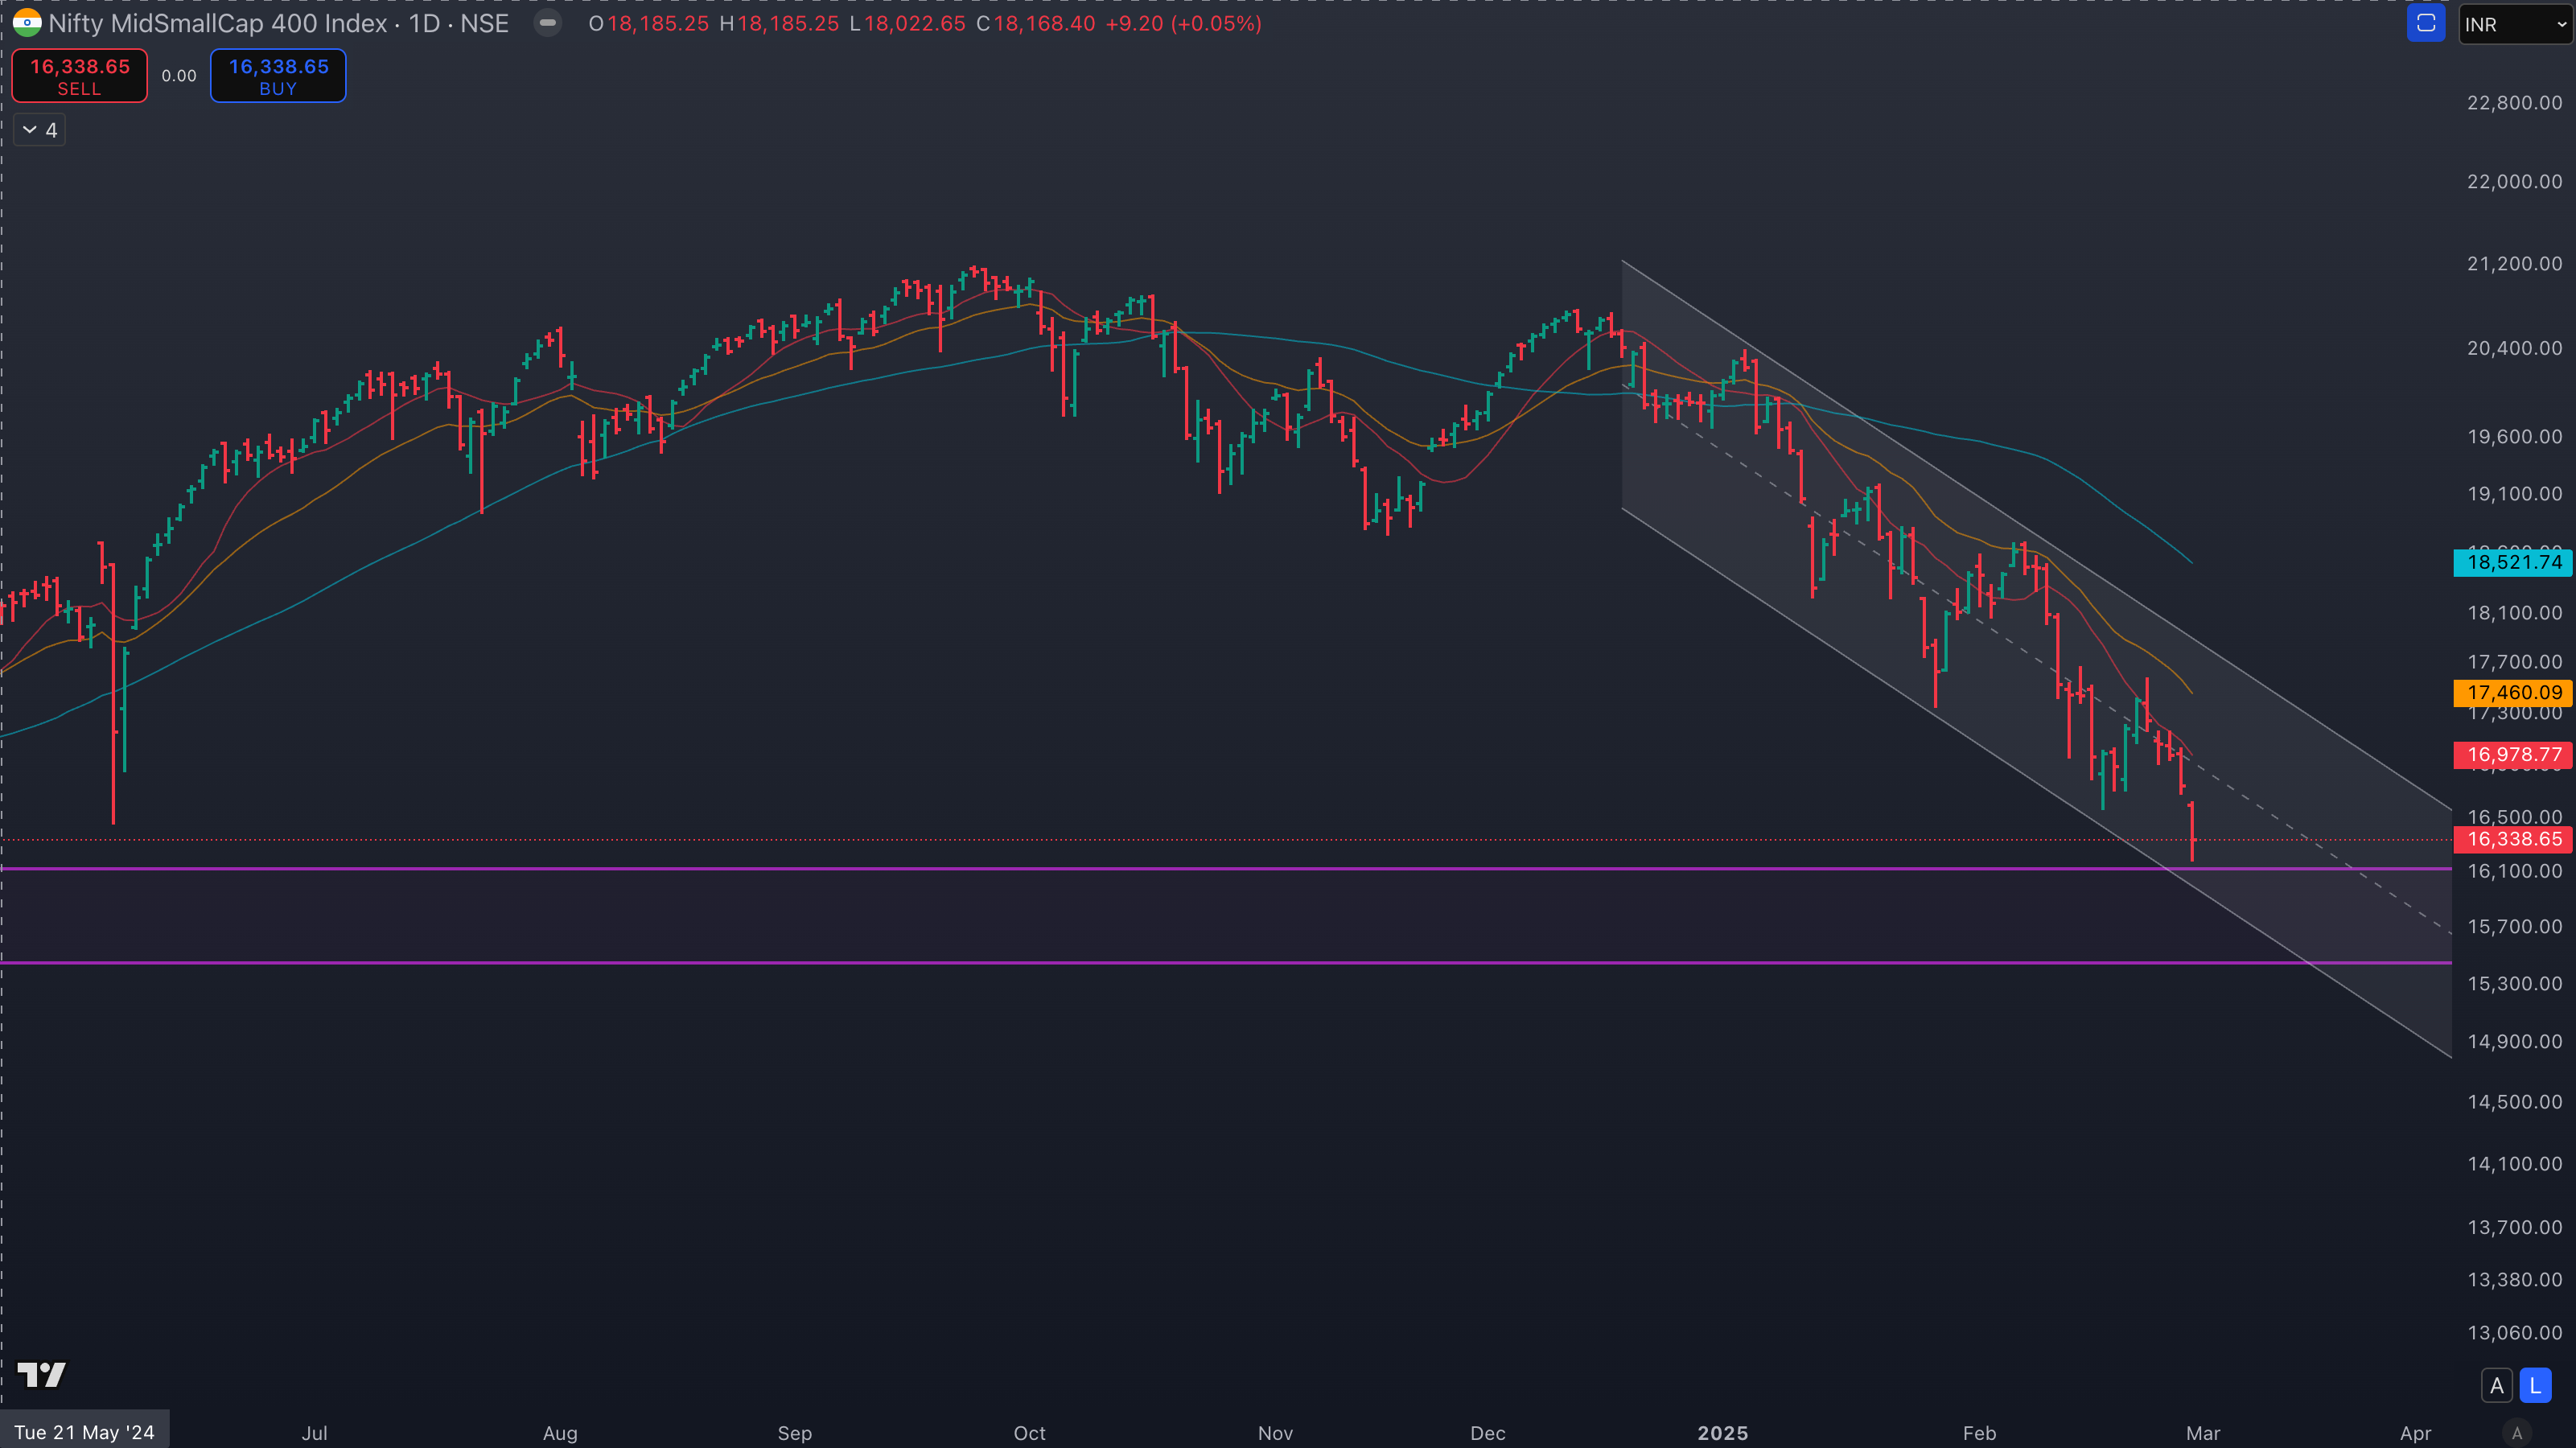
N500:
Downtrend.
Fall continues after the meek bounce got slapped by the falling 10-DMA.

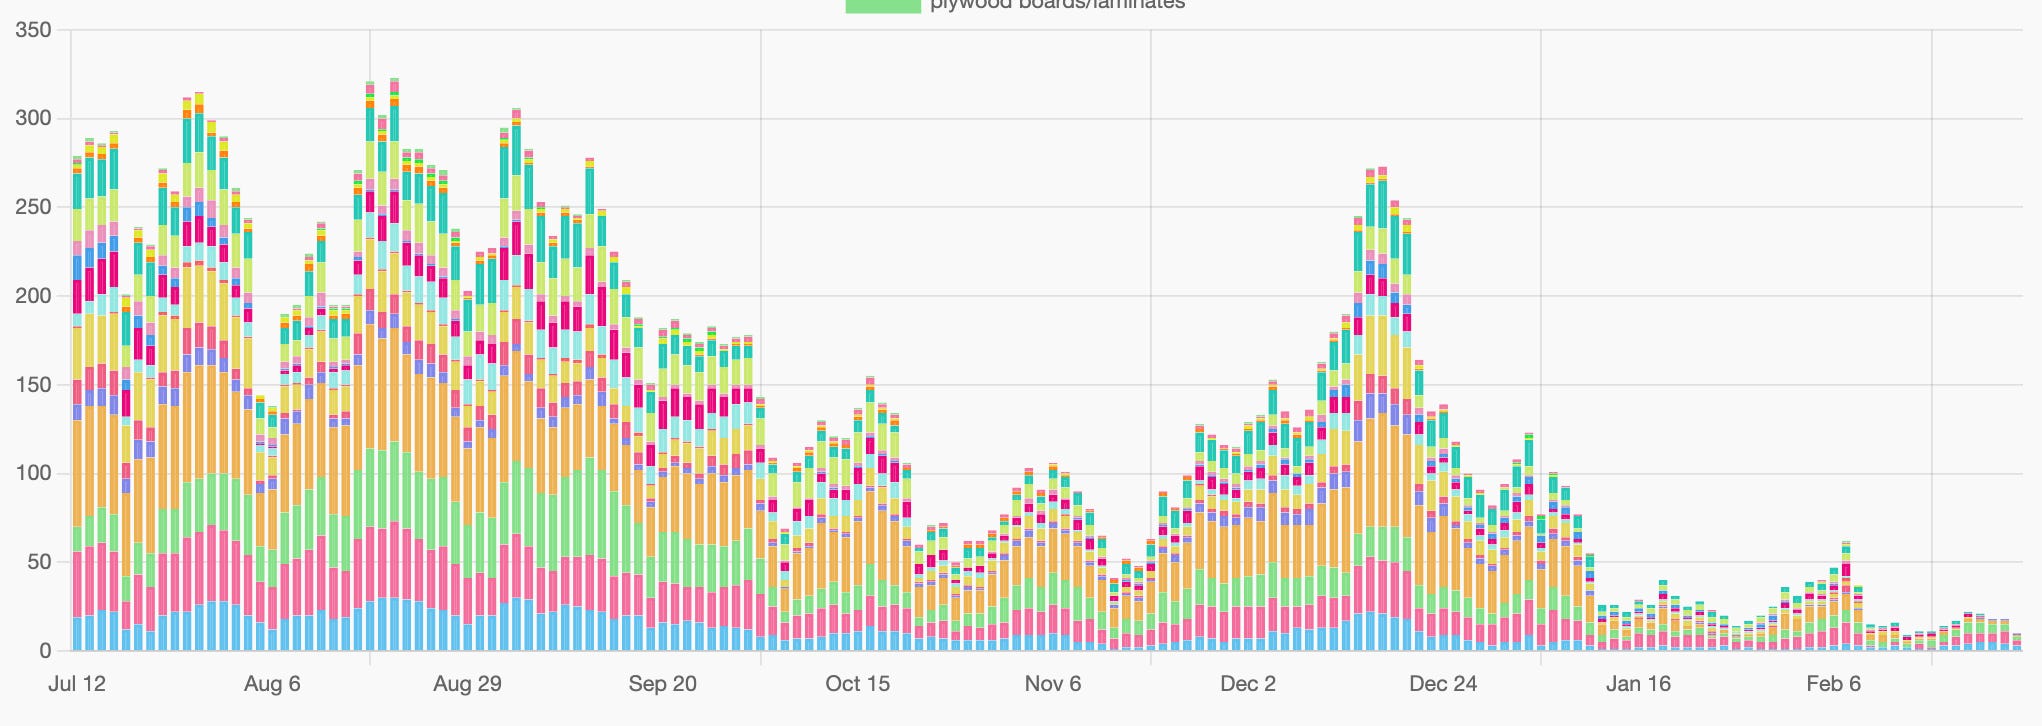
Net4% Movers:
Another extremely bearish week with a downward acceleration to close the week.

Anticipation:
So the downleg continued the whole week. How could things unfold next?
We are highly oversold in all timeframes right now, however, the capitulation is missing.
The indices around the March 2024 support levels.
I anticipate a swing low to be formed soon.
But not before a day (or two) of capitulation to the downside, taking the short term breadth to further oversold levels.
The oversold bounce that would follow would still be a counter trend bounce (Caution: These bounces are often short-lived and notoriously difficult to play).
Still No Money for swing and positional traders.
PS: Anticipations are often wrong and bias should be adjusted with every candle.
If you dont know this already, I update my Market MATH every day on my website under the BREADTH section. Please check in every day post-market.
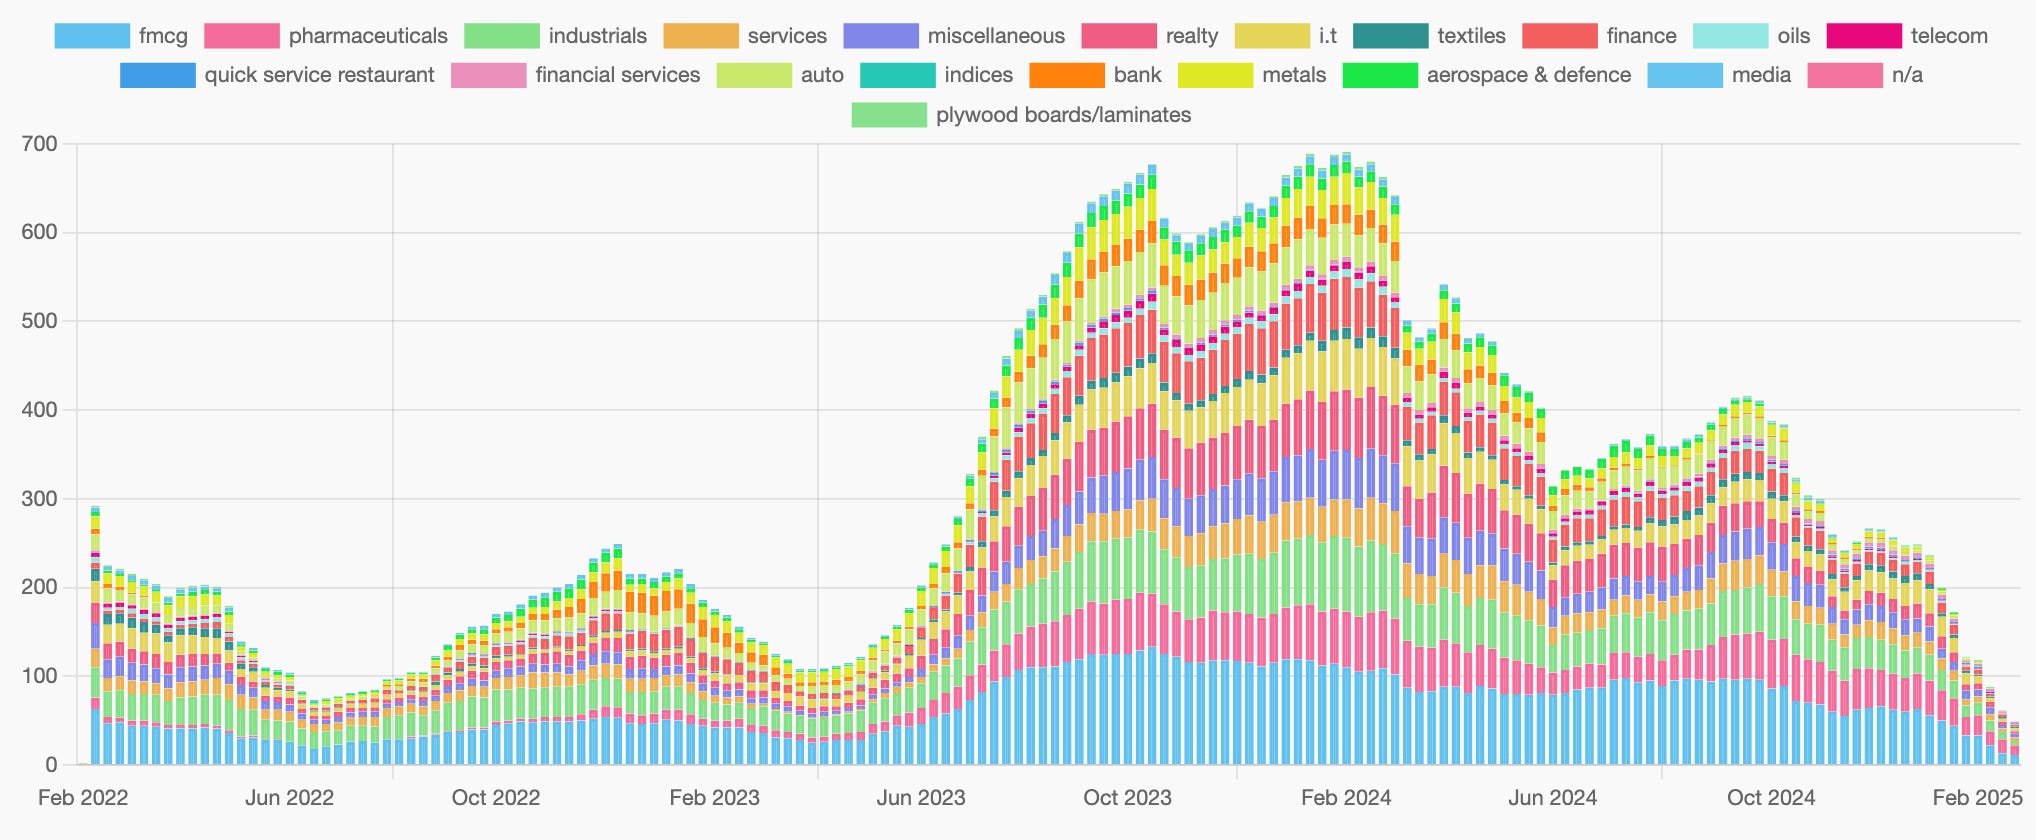
Group Strength:
The strongest groups:
Index: NA
Groups:
It is difficult to put a pin on a specific group while the market is on a downtrend.
If still trading, best to take a bottoms-up approach by looking at individual stocks from the relative strength list.
Watchlists:
Follow the Strongest Stock (the RS 100 names):
Intraday tradable names would be found on the Strong Start candidates every day:
https://www.sakatashomma.com/scanners
Watchlist(s) below
Keep reading with a 7-day free trial
Subscribe to The Technical Take to keep reading this post and get 7 days of free access to the full post archives.