MATH: Momentum Anticipation and Trend by Homma:
MATH last week: Click the link
The most comprehensive article on Breadth and Anticipation:
As technical traders, We
“Anticipate, but confirm. Wish, but only react.”
Trend:
Short-term: “Percentage of stocks above 10-DMA”
Medium-term: “Percentage of stocks above 50-DMA”
Long-term: “Percentage of stocks above 200-DMA”
After crossing the 5-DMA on the upside last week, the short-term trend is now threatening to be extended, the medium-term is around the previous swing high, and the long-term forming a swing low around the 50 mark.
Momentum: Homma Mswing Score
The Mswing score trended up the whole week until the last day.
It threatens to curl down again now.
N50:
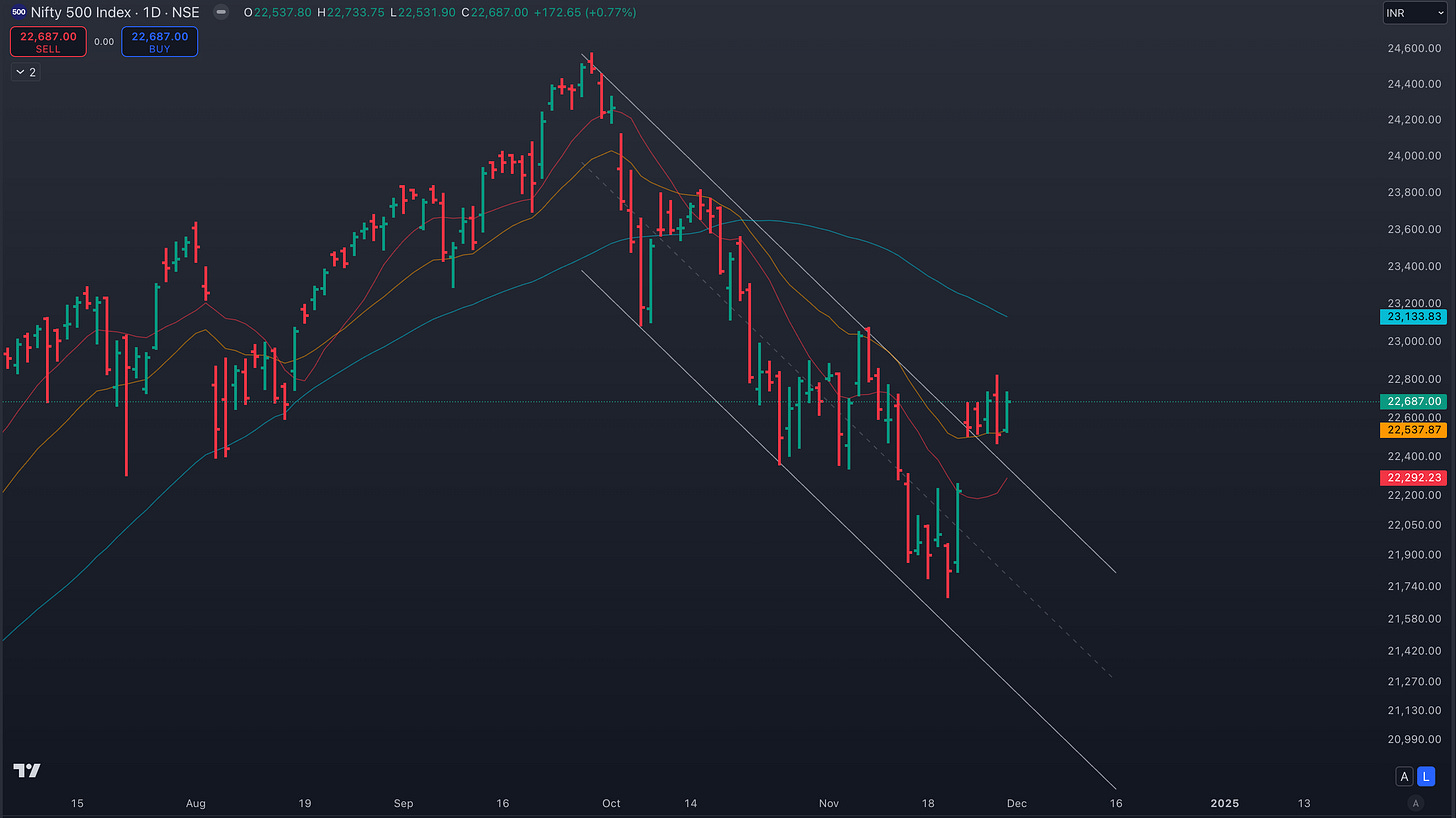
Looks to have broken out of the channel.
Still on a downtrend as we printed a lower High.
Still under the declining 50 DMA.
Built a clear resistance above which the bias turns bullish.
N500:
Same as N50
Net4% Movers:
We had a bullish week printing positive Net4% print every day of the week.
Anticipation:
We had a bullish week.
Short-term we look near the extended zone and hence a pullback can be anticipated.
The momentum plots also suggest a slowdown and/or pullback in momentum.
A parallel can be drawn to the 1st November week which had a bullish week.
That week had all day bullish Net 4% print and short-term trend at oversold.
The difference this around is that we have better accumulation volumes.
I anticipate a sideways chop or a pullback at best.
I do believe that we may have a higher low from where a decent rally can be expected.
But, I will not be surprised one bit if we test the previous lows.
As long as we trend below the 50-day, bias remains cautiously bearish.
Group Strength:
The strongest groups:
Index:
Nifty IT, pharma-health
Groups:
The beaten-down leaders of the bull market had big gains this week viz. Defence, Railways, PSUs, Telecom etc
Rating agencies, EMS, and pharma API Crams continue to be strong.
Fertilizers and packaging are strong as well.
Watchlists:
The RS100 list saw the best movers this week.
I believe that list would do well going forward as well if the market holds up well.
Keep reading with a 7-day free trial
Subscribe to The Technical Take to keep reading this post and get 7 days of free access to the full post archives.


