Market MATH & Watchlist: 24-Nov-2024
Bias: A possible countertrend bounce but bias remains bearish
MATH: Momentum Anticipation and Trend by Homma:
MATH last week: Click the link
The most comprehensive article on Breadth and Anticipation:
As technical traders, We
“Anticipate, but confirm. Wish, but only react.”
Trend:
Short-term: “Percentage of stocks above 10-DMA”
Medium-term: “Percentage of stocks above 50-DMA”
Long-term: “Percentage of stocks above 200-DMA”
All are below their Bullish thresholds of 50.
But, they have crossed above their 5-DMAs.
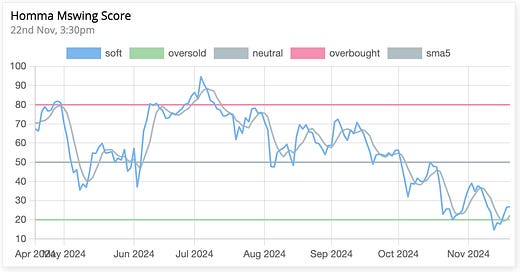
Momentum: Homma Mswing Score
The Mswing score bounces back above the oversold level.
But is still below 50 and making LL-LH.
This needs to start trending Up and the Landry template needs to breakout above the oversold level for the market to be conducive again for longs.
N50:
The H&S almost reached its pattern target.
Still inside a descending channel.
Still under the declining key MAs which are acting as resistance.
2 key levels of resistance are marked.
Bias bearish below these (and the declining 50DMA)
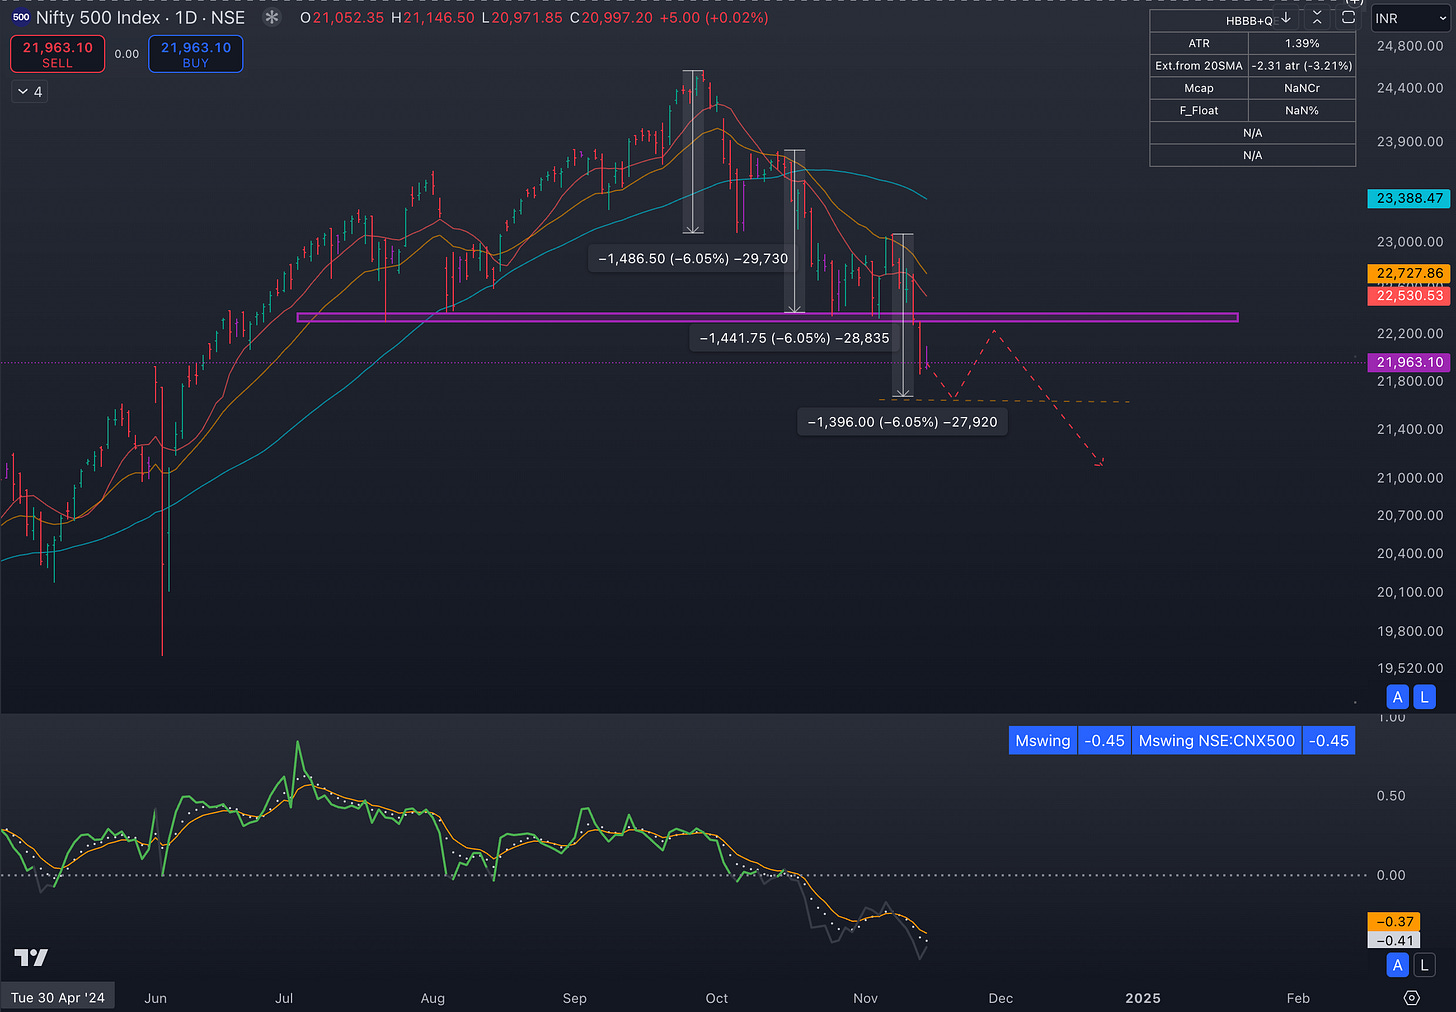
N500:
This chart was N500 last week.
It is acting according to the anticipation, i.e. we have a downmove followed by a countertrending bounce.
Similar to N50, it is inside a bearish descending channel with 2 key resistances.
Bias will be bearish as long as it trends below these levels.
Net4% Movers:
We had a mixed bag last week.
A clear tussle between sellers and buyers can be seen with the Net4% scores of ~ -2, 7, -4.5, and 5.6 respectively.
Anticipation:
I start by stating the facts i.e. we are on a downtrend and that we had a weak bounce/rally attempt to the close of last week.
We are still below the key MAs.
The bias is therefore bearish at this point.
We can expect a counter-trend bounce/rally.
But there is nothing that guarantees that it will lead to a sustained move.
The positive sentiment around the Maharashtra state elections could fuel this rally.
But I will not be surprised if it turns out to be that tide that will lift your boats higher, only to smash them to pieces onto cold dark rocks.
I anticipate that to be the case, we rally to the key MAs (possibly even the 50s) and then trend down.
This bias will change if we build higher lows around the key MAs.
Group Strength:
The strongest groups:
Index:
Nifty IT
Groups:
EMS, Diagnostic chains, Hospitals, Rating agencies, pharma, API, Hotels, Transformers & Solar Panels.
Watchlists:
I use the Strong Start scanner for stock selection here.
You can find them during the first 5 minutes of the day using the scan Strong Start on the scanner section of my website
.I am keen on the Mid-Small-Microcap space from the stronger sectors. Apart from the usual watchlist, I am sharing this broader list as well today. Just to keep tabs and be ready in case bullishness becomes apparent to act.
Broader list: https://www.tradingview.com/watchlists/127658840/
Keep reading with a 7-day free trial
Subscribe to The Technical Take to keep reading this post and get 7 days of free access to the full post archives.


