


Market MATH & Watchlist: 15-Feb-2025
Bias: of a counter-trend bounce

MATH: Momentum Anticipation and Trend by Homma:
MATH last week: Click the link
The most comprehensive article on Breadth and Anticipation:

As technical traders, We
“Anticipate, but confirm. Wish, but only react.”
Trend:
Short-term: “Percentage of stocks above 10-DMA”
Medium-term: “Percentage of stocks above 50-DMA”
Long-term: “Percentage of stocks above 200-DMA”
Downtrending and at oversold levels in all timeframes.

.
Momentum:
No momentum whatsoever. At zilch levels for the entire week.

Landry Daily: (Momentum Bias for Swing Play)
It has trended down throughout the week after printing a lower value on last week’s close
.
Landry Weekly (Momentum Bias for Positional Play):
Trending down.
For an easy-money environment to sustain for positional trading, this plot needs to start trending upward.

INDICES:
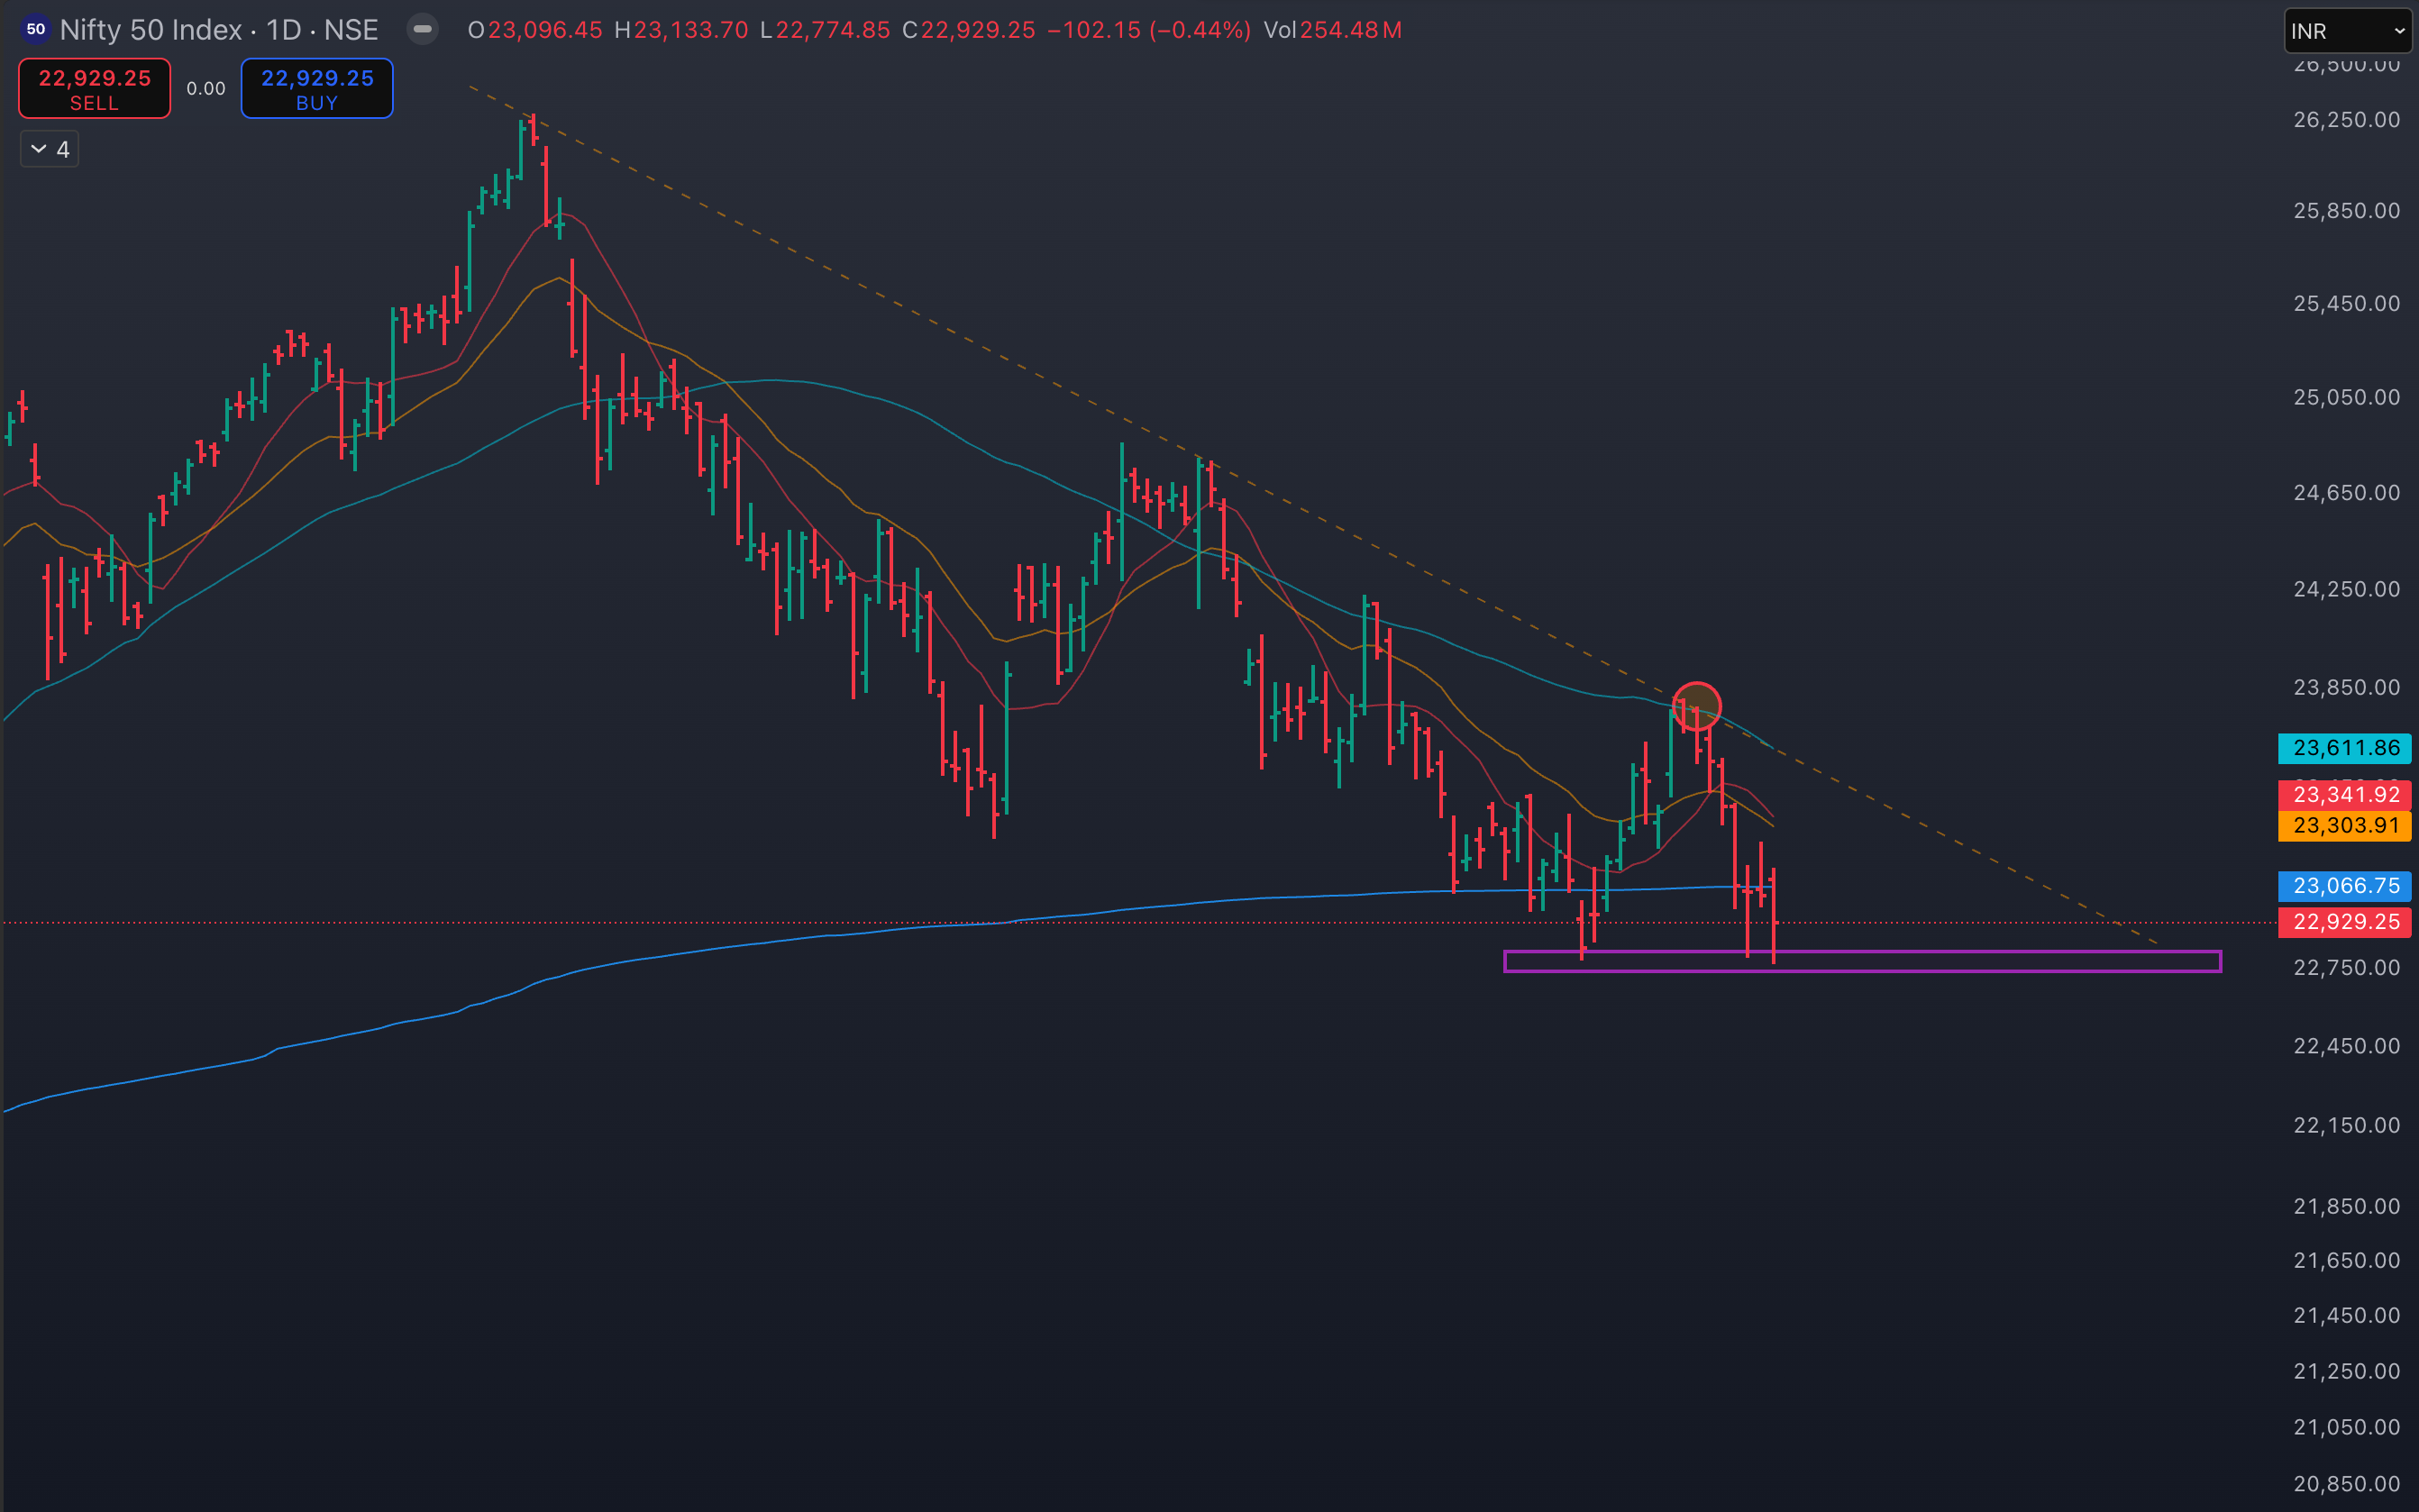
N50:
Downtrend.
Slapped by the DTL and 50-DMA, now at a plausible support.
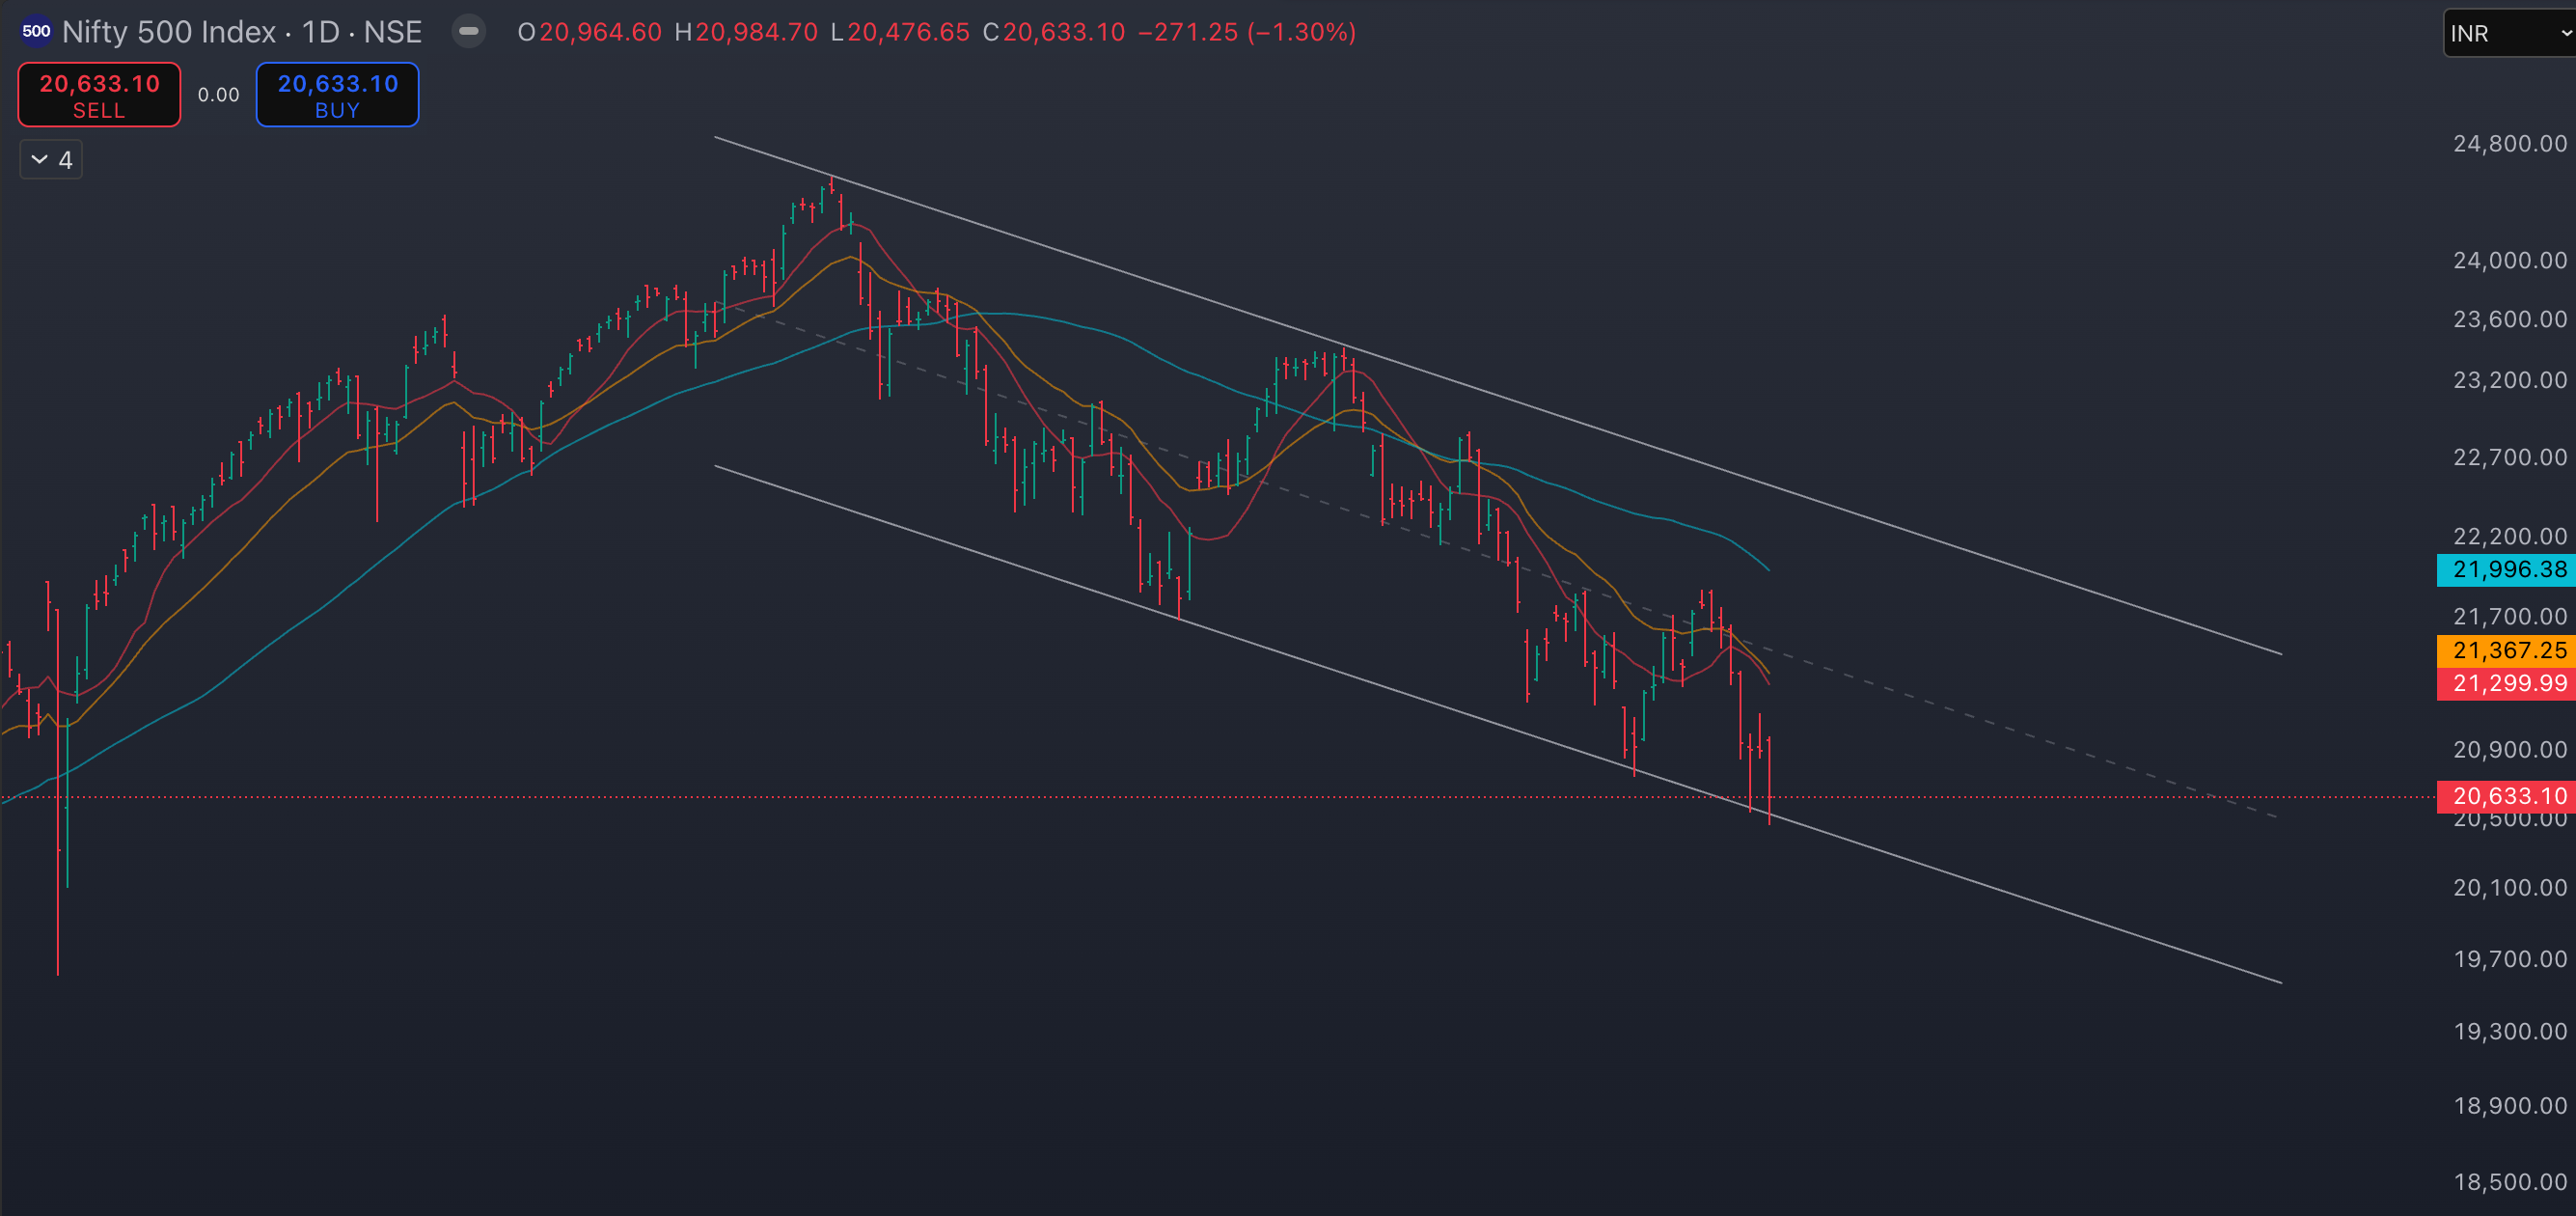
N500:
Downtrend.
At a plausible support of the Downtrending Channel.
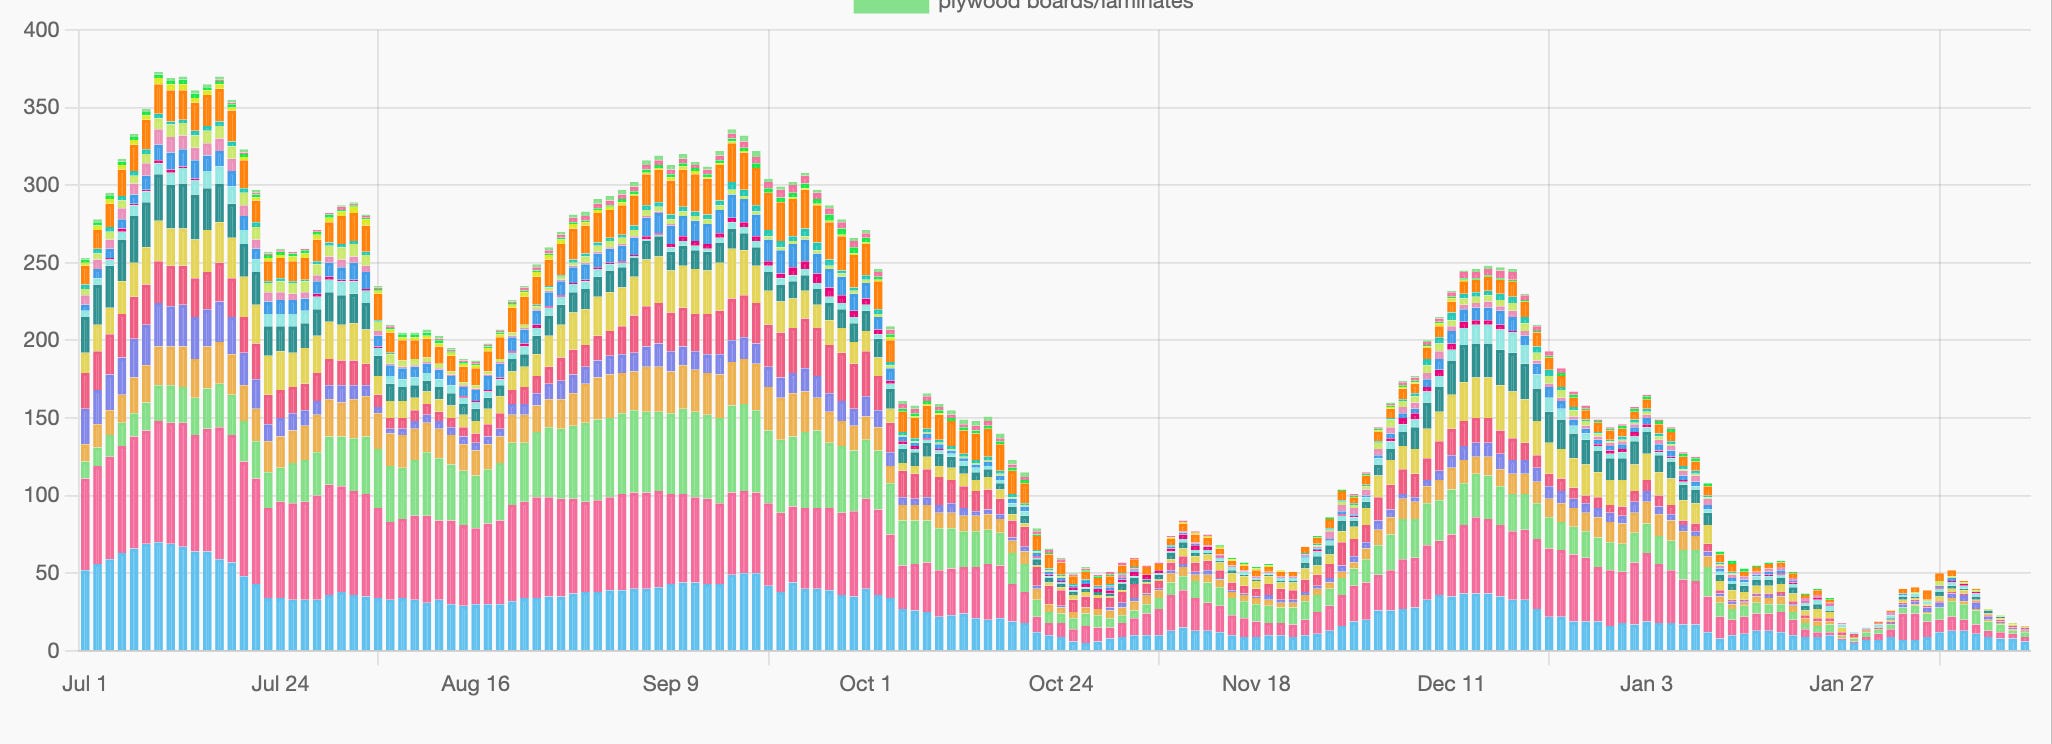
Net4% Movers:
Extremely bearish week.
All days had a negative 4% print.

Anticipation:
That’s what happened this week. How could things unfold next?
The Breadth is extremely oversold in all timeframes. Even during a bear market, this occurrence is rare and it is bound to lead to a counter-trend bounce sooner than later.
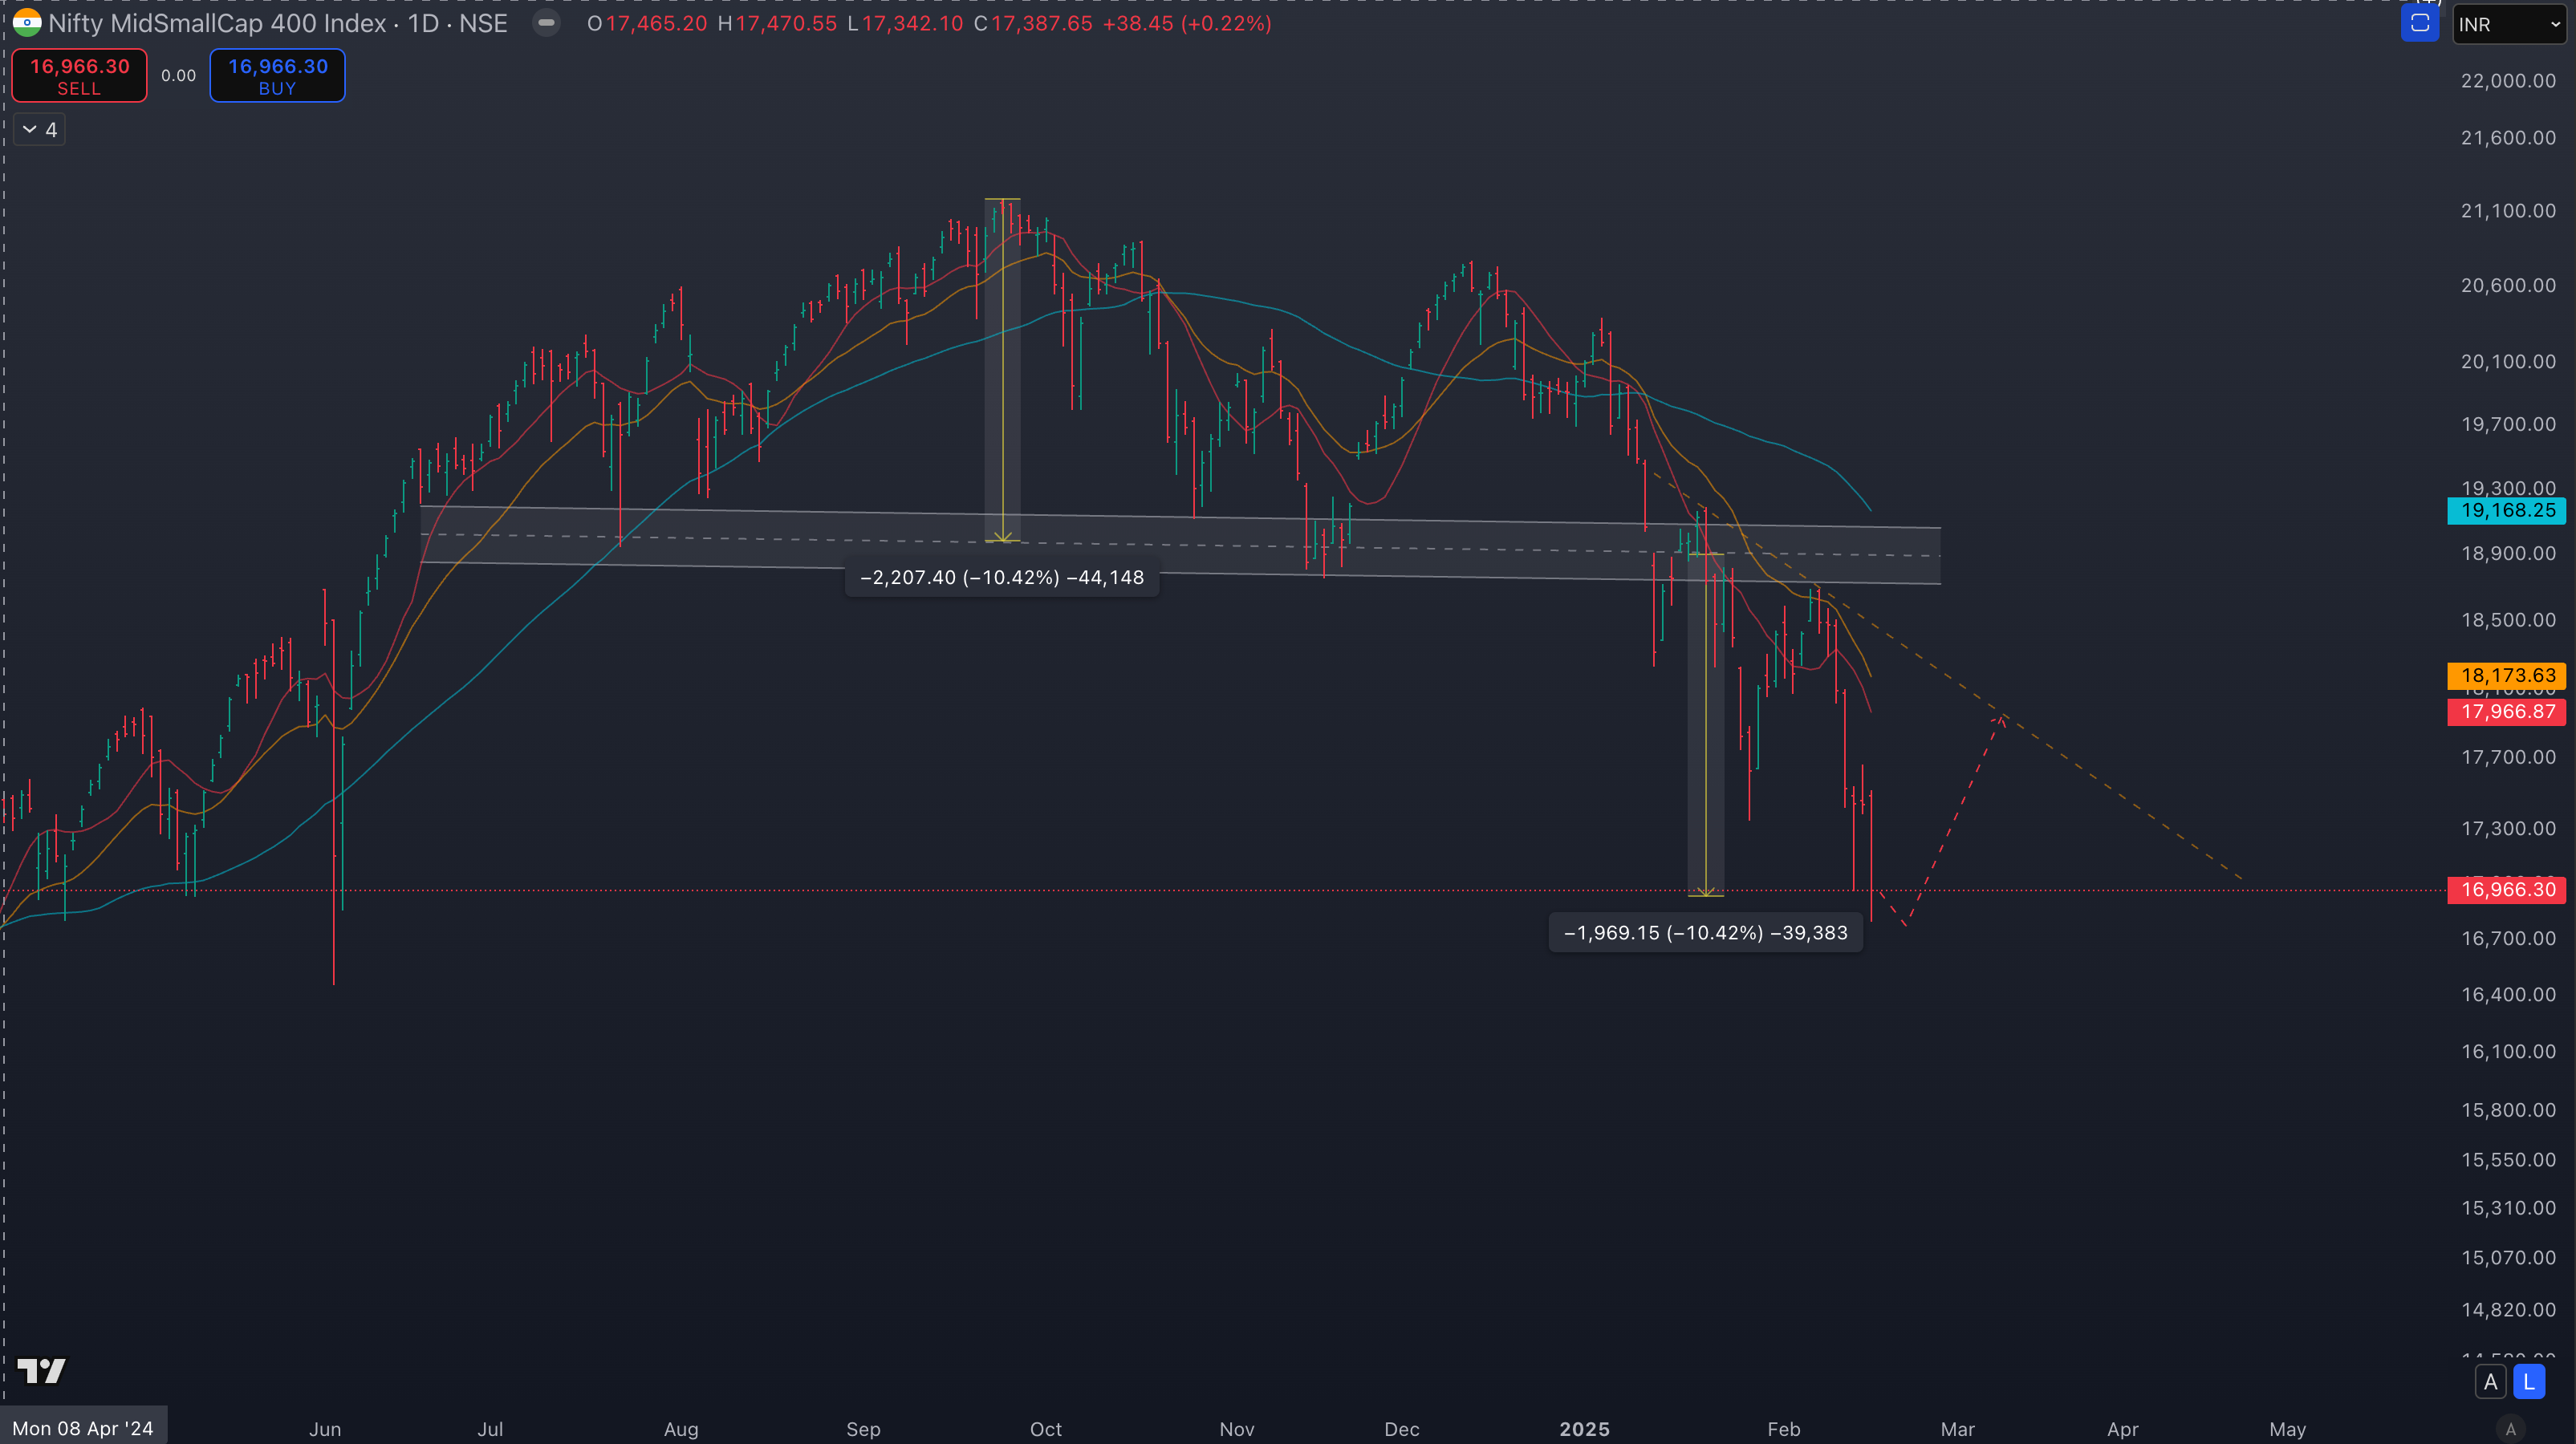
Most indices are now at the H&S breakdown pattern target.
I anticipate therefore a counter-trend bounce is due. There was one attempt on 13th Feb which failed. If successful, I believe we can at least rally till the falling 10/20 MAs.
Still No Money for positional traders.
PS: Anticipations are often wrong and bias should be adjusted with every candle.
If you dont know this already, I update my Market MATH every day on my website under the BREADTH section. Please check in every day post-market.
Group Strength:
The strongest groups:
Index: NA
Groups:
It is difficult to put a pin on a specific group while the market is bearish.
If still trading, best to take a bottoms-up approach by looking at individual stocks from the relative strength list.
Watchlists:
Follow the Strongest Stock (the RS 100 names):
Intraday tradable names would be found on the Strong Start candidates every day:
https://www.sakatashomma.com/scanners
Watchlist(s) below
Keep reading with a 7-day free trial
Subscribe to The Technical Take to keep reading this post and get 7 days of free access to the full post archives.