What is a trend?
Is Nifty in a downtrend? 5 minute read
What does a stock do at any point in time?
It does one of two things.
It TRENDS, or
BASES.
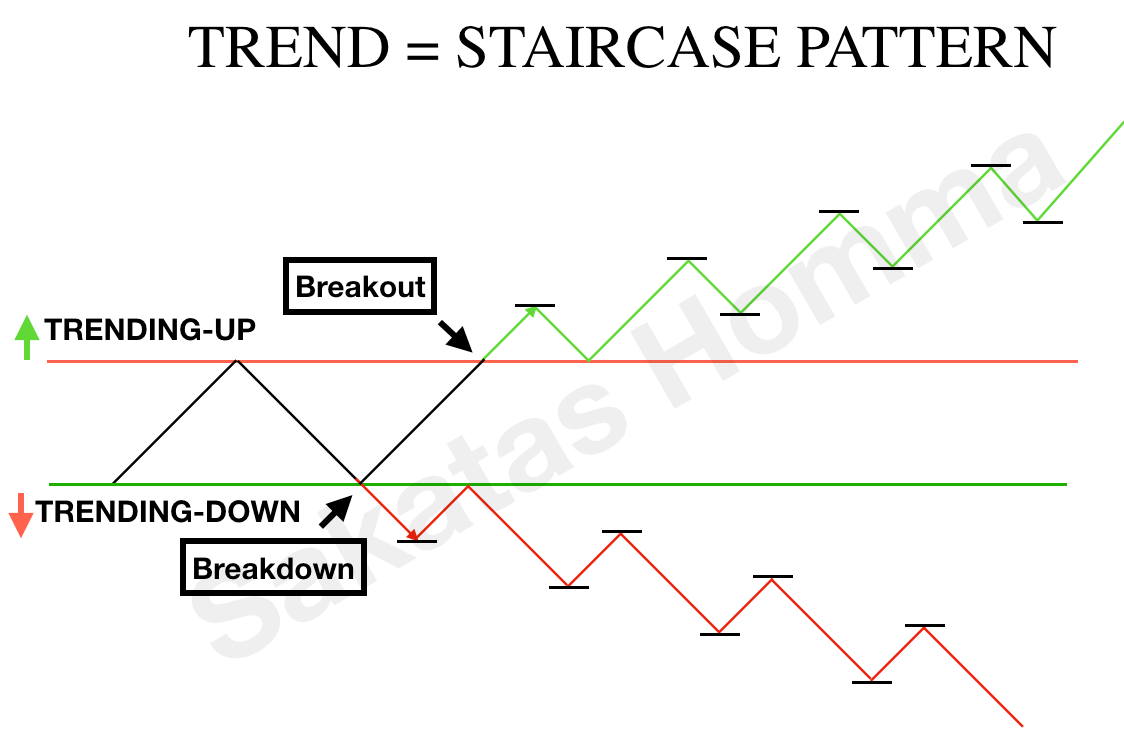
By basing, we mean that the price moves inside two specific price levels. This means we can define the BASE with 2 horizontal lines: the upper and the lower PIVOT.
Now, if the price breaks out or breaks down of the upper/lower pivot then it is no longer basing and has started a TREND.
If it breaks out, it is the start of an UPTREND; if it breaks down, it is the start of a DOWNTREND.
For the trend to continue, i.e for the price action to be called as still trending; it has to follow a pattern which can be called the STAIRCASE.
An upward staircase is characterized by the price action of Higher-Highs and Higher-Lows (HH-HL) whereas, a downward staircase is characterized by Lower-Lows and Lower-Highs.
Now that it is clear what a trend (& a base) is, why is it important?
Simply because once a trend starts, it has the bias to continue. Think of it like Newton’s law of inertia, which says that an object in motion (or rest) tends to stay in motion (or rest) until an external force is applied. Similarly, stock in a trend (or inside a base) tends to stay in the trend (or inside the base) until a high volume of buying/selling happens.
This phenomenon is at the heart of all Breakout setups. In any breakout setup, the buy trigger is always when the price crosses an upper pivot of a base. Some bases may be bigger (weeks to months) while some will be smaller (days). Some will have a prior uptrend before the base (Cup and handles, Flags), while some may occur after a downtrend (inverse Head & Shoulders). But there always is a higher pivot and a crossing of that pivot.
Trends are defined wrt to a Timeframe:
Another important concept with respect to Trends is that of the timeframe. You cannot define a trend without defining the timeframe first.
A swing low can be a lower low at a lower timeframe, while it can be a higher low at a higher timeframe.
Therefore, the stock can be in a downtrend daily but in an uptrend in weekly and vice versa.
So is Nifty in a downtrend then?
Yes and No.
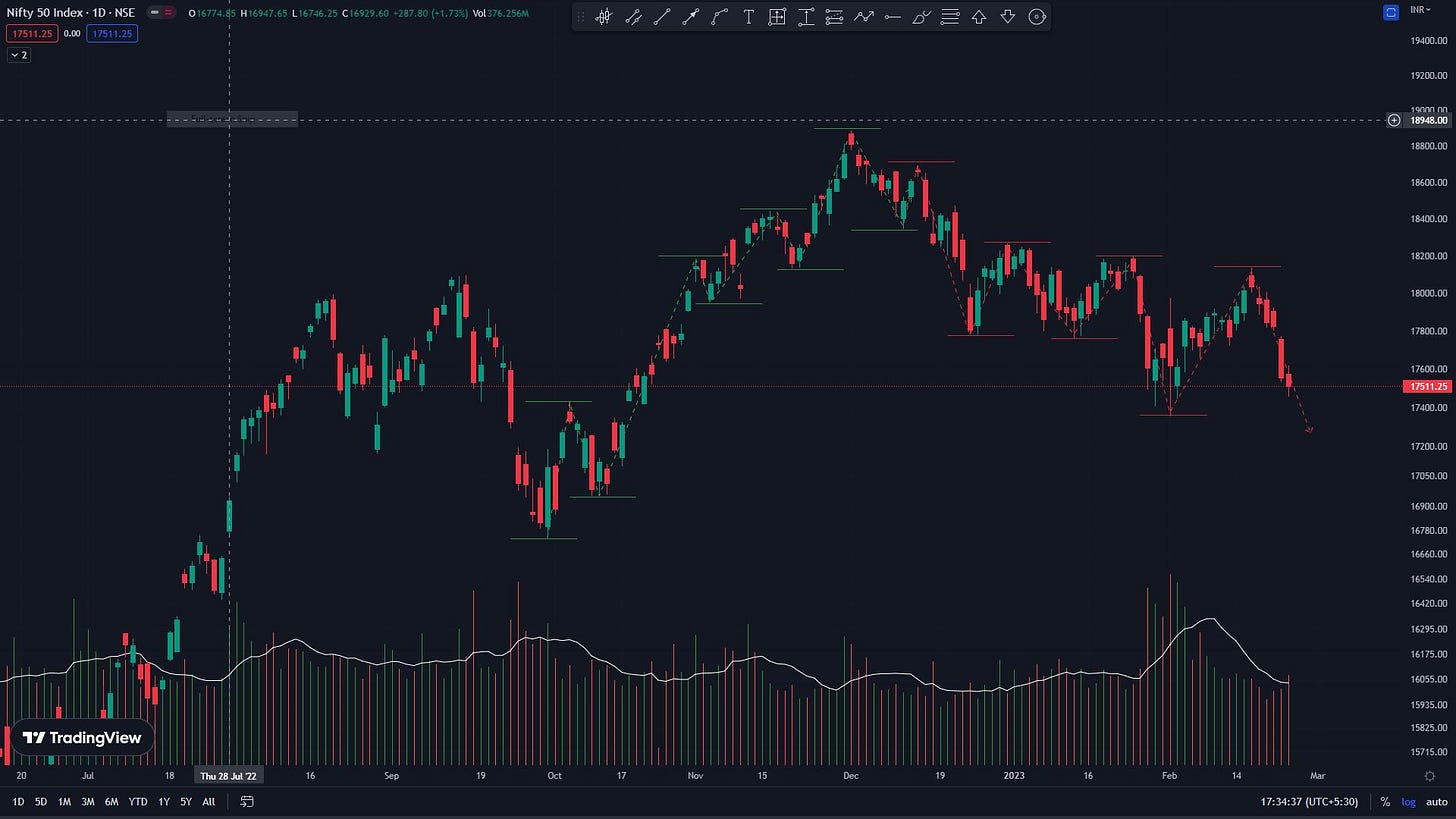
If we view the daily trend it is indeed forming LH-LL structure and hence is on a downtrend. But on a weekly timeframe, it still is on a nascent uptrend as the recent swing low is higher than the previous low; and the recent swing high is higher than the previous high.
Nifty 50: Daily = Downtrend
Nifty 50: Weekly = Uptrend
What is the implication of this?
Once you know the trends inside out, your trading signal should align with the timeframe and holding period of your trade.
You cannot be a long-term investor and make buy-sell decisions by looking at the daily trend. Conversely, you cannot be a day trader and make your buy-sell decisions on the daily time frame too; you have to go down to a 5-minute or a 15-minute time frame.
The point I am making is this.
It is already difficult to stay idle with our positions; this becomes even more difficult when you don’t know if we are in an uptrend, downtrend, or any trend at all.
I hope this article brought some clarity as to what a trend is and how it is helpful for a trader/investor.
If you want to have more of these trading and market-related topics simplified to the T, please subscribe to the newsletter and share it with your market-enthusiastic friends as well.
You will only hear from me once a week via this newsletter. If you want to hear from me more often, please follow me on Twitter. I also teach a technical analysis masterclass for beginners. A 16-hour session in total, we have the classes on weekends. Check out the 1st session for free on my Youtube channel.
That is all for this weekend.
Until next week. Signing off
~ Prakash


