"The perfect entry is a momentary thing. You blink, and its gone"~ HommaSo,
What is this “Tightness” that peak swing traders are always looking for?
How does it help? Why do swing traders need a Tight area?
How “Tight” is Tight enough?
Why does the location of Tightness matter as much as the Tightness itself?
And lastly,
Can we scan for this Tightness? If yes, in how many ways?
I will answer these questions in this article.
Disclaimer: Nothing discussed in this article is a buy-sell recommendation.
What is Tightness?
A price action where the price is sideways and range-bound in a small range for some time (in any timeframe).
How small should the range be to be considered tight enough?
About 1X of its ATR(10/20-period).
So for a high ATR stock (say most mid-small cap stock), this range would come around 4-6% percent.
While for a large-cap stock, this value would be around 2-3%.
How long should it be rangebound for?
Minimum 2 candles.
4-5 candles tight is good.
“Tightness” therefore is an extreme volatility contraction.
As volatility is cyclical (like everything else in the markets), a contraction in volatility is followed by an expansion.
As swing traders, we are looking to trade this expansion.
Examples:
Paras Defence Daily: Smallcap
A tightness of ~6% for 4 days before breakout. ATR(14) = 5.5%
Infy: Largecap
A tightness of ~1.9%. 4 days. ATR(14) = 1.92
Notice that, even though Paras’s tightness was 6% and Infy’s is 1.9% which is 1/3rd of Paras. They are both similar quality in tightness.
Why? Both are tight around 1X of their respective Average True Ranges.
Let’s look at one more example, on an intraday time frame.
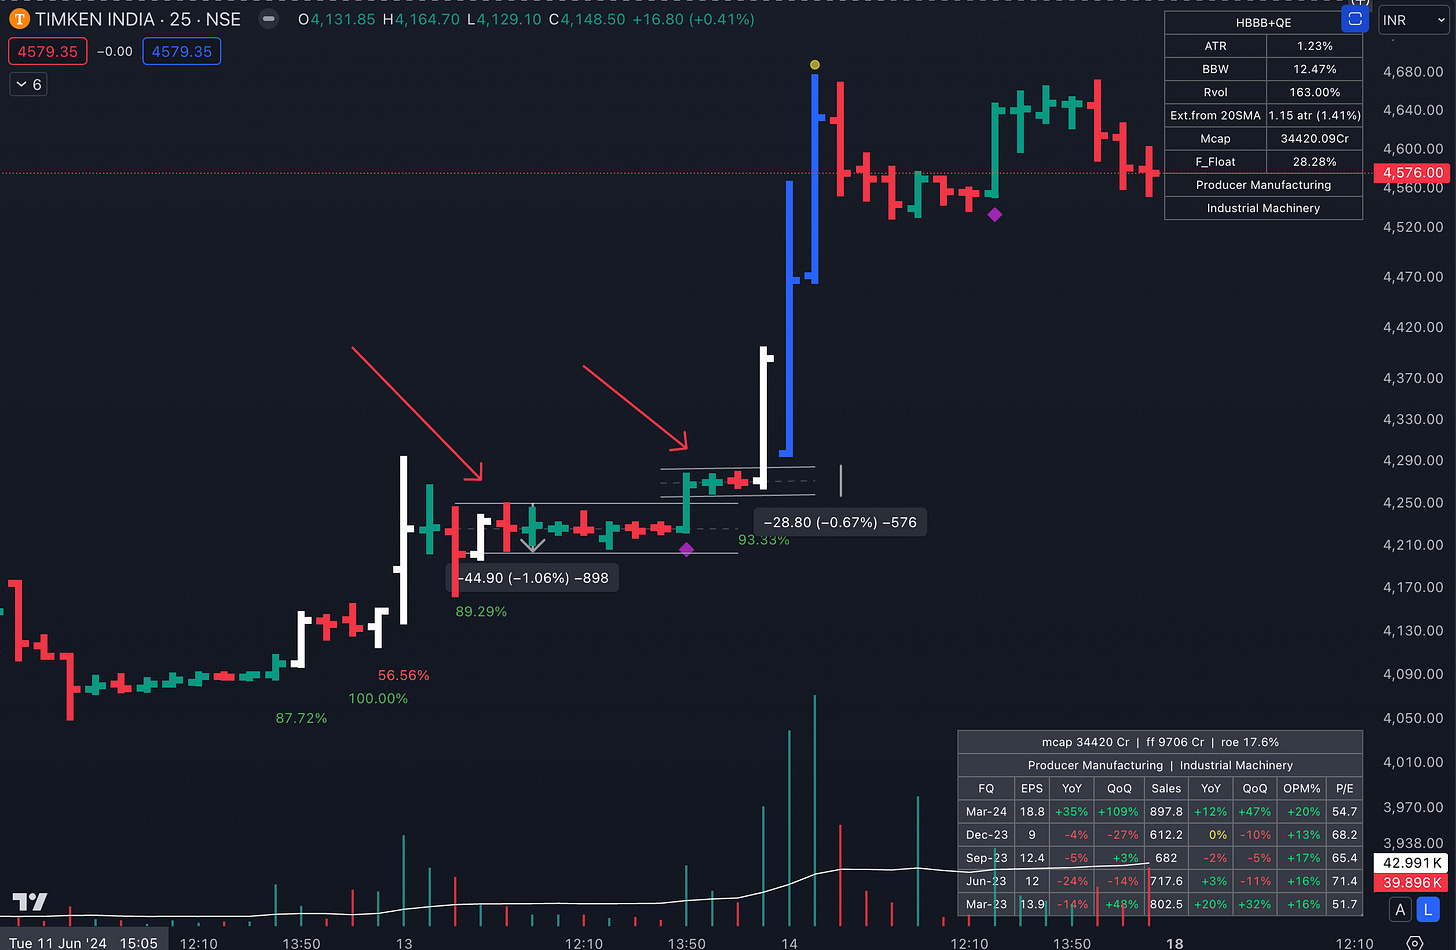
Timken 25 minutes:
2 Tight areas marked ~1% and ~0.7% respectively. Both are tighter than their ATR(14).
Say what? Extremely Tight!
Why do swing traders need a tight area?
The setup is essentially a range breakout setup (i.e. a momentum burst setup).
The trade is triggered once the price breaks out of the range.
The setup fails if the price moves back and below the lower end of the range.
Therefore, the low of the tight area provides a legitimate pivot to manage risk.
Stoploss goes below the low of the tight area (Not exactly the low but some points below).
The tighter the setup, the smaller the stoploss.
The smaller the stoploss, the higher the position size.
Swing traders lowe small SL (big size).
Hence, they also lowe Tightness.
Why does the location of Tightness matter as much as the Tightness itself?
Well,
The prior trend of the stock is mui importante.
Strength begets strength.
A stock basing tightly on an uptrend has a much higher probability of breaking out on the upside than a stock basing tightly on a downtrend.
So, don’t make this beginner-level mistake of trading a long breakout on a downtrending stock.
The odds are just not in favor.
Example:
Shown below is a chart with two tight breakouts.
One is on a downtrend, and another is on an uptrend.
Of course, this is a cherry-picked example. However, the nature of trends is such, this is how probabilities work out.
Hence, always trade in the direction of the trend. Always
Can we scan for this tightness? If yes, in how many ways?
Yes. You bet we can.
In a gazillion ways.
Here are some ideas for you:
(Range in X bars) <= ATR(X)
Bollinger Band Width (X bars) divided by ATR(X) <= 2 (This is partially John Carter’s famous squeeze system).
The last X bars close price closed with X% of each other (3-weeks tight is derived from this).
Inside Bars (IBs): 3 tandem IBs, Weekly IBs,.. etc
This topic has to be a separate article altogether (And might deserve a long-form video as well).
Watch this short video (link) where I show how to scan intraday tight setups on F&O stocks. I use the Carter Squeeze system here (2nd on the list).
But, all roads will lead to Rome.
All these systems will lead you to the same set of Tight stocks.
That’s all for today.
Profitable trading is about having a system you trust and following it consistently.
For that, you have to optimize the system in a time-efficient manner.
Having the right set of technical tools is a game-changer.
Imagine finding the 10 best tight setups on the top 10% of the strongest stock with a single click (30 seconds).
Vs,
Manually going through 500 charts in 50 minutes (that is if you are a Pro).
That's 49.5 minutes saved. Everyday
If you want to learn:
How to leverage technical tools to build yourself a trading system that is both PERSONAL and consistently profitable, Homma Private Access (HPA) will help you achieve that.
Details below:
Join the Sakatas Homma TA masterclass for beginners:
A complete course containing 8 Hourly sessions. Once a year.
To register for the next live masterclass, please fill out this form.
Watch the 1st session of the Autumn 2023 masterclass.
To access the full 8 sessions, contact us via WhatsApp @ 9481506784
Homma Private Access membership:
HPA is a subscription-based educational service (on WhatsApp). Benefits include:
Daily Market Breadth, Momentum, Sector Rotation, and Relative Strength Update.
Access to all my scanners including the BBB (buy before breakouts) scanner, and the Homma Khela Hobe 2.0 scanner.
Access to my proprietary Breadth-Momentum-Relative Strength & Sector Rotation dashboards.
Access to my Trading view indicators: Homma Khela Hobe, Buy before Breakouts (BBB), Homma Endgame, etc.
Access to live Telegram alerts to Homma Khela Hobe, Homma Pullback, and TGP scanners.
HPA Weekly: Hourly weekend deep dives and Q&A.
1-year access to The Technical Take premium.
Live alerts to high-risk-reward setups breaking out.
Live updates on my portfolio and the trading setup rationale.
Access to my high probability watchlist.
Yearly membership of 15000/- INR only.
UPI payment & WhatsApp @ 9481506784.
Yours
Sakatas Homma.


Bro, How to find this type of charts? Is there any screener or something?