This is how I use Stock Bee's 4% Breakout strategy to spot Sector Rotation.
I caught the Insurance & Fertilizer sector breakout using this.
"To create quality, you have to create quantity first." ~ Anonymous
So you wanna know which sector(s)/group(s) are gaining strength today in the market?
I will tell you the most direct way to know this.
Look at this list:
“>4% movers”.
I will discuss the logic behind why this works.
Tell you how I caught insurance (and fertilizers) breaking out.
And link the scanner so that you can run it every day.
And my 4% movers dashboard for the premium readers.
4% move = Bullish
Most stocks don’t make a >4% move on a given day (large caps rarely do).
In their whole journey, they move more than 4% probably <20% of the time (I made these statistics up. But go figure).
So when they do, it means that there is STRENGTH.
Now when you see more than 20-25% of stocks from the same sector moving more than 4% on the same day, and continuously for a bunch of consecutive days.
What does it tell you?
Yes, sectoral strength. The whole sector/group has STRENGTH.
As simple as that.
Now I say 20-25% and not 20-25 stocks.
this is important.
Because a group/sector with ~300 stocks (FMCG) having 20 stocks in the >4% movers list; is not the same as one with ~40 stocks (Banks) having 20 stocks on the same list.
How do you check >4% movers?
Run this >4% scan below:
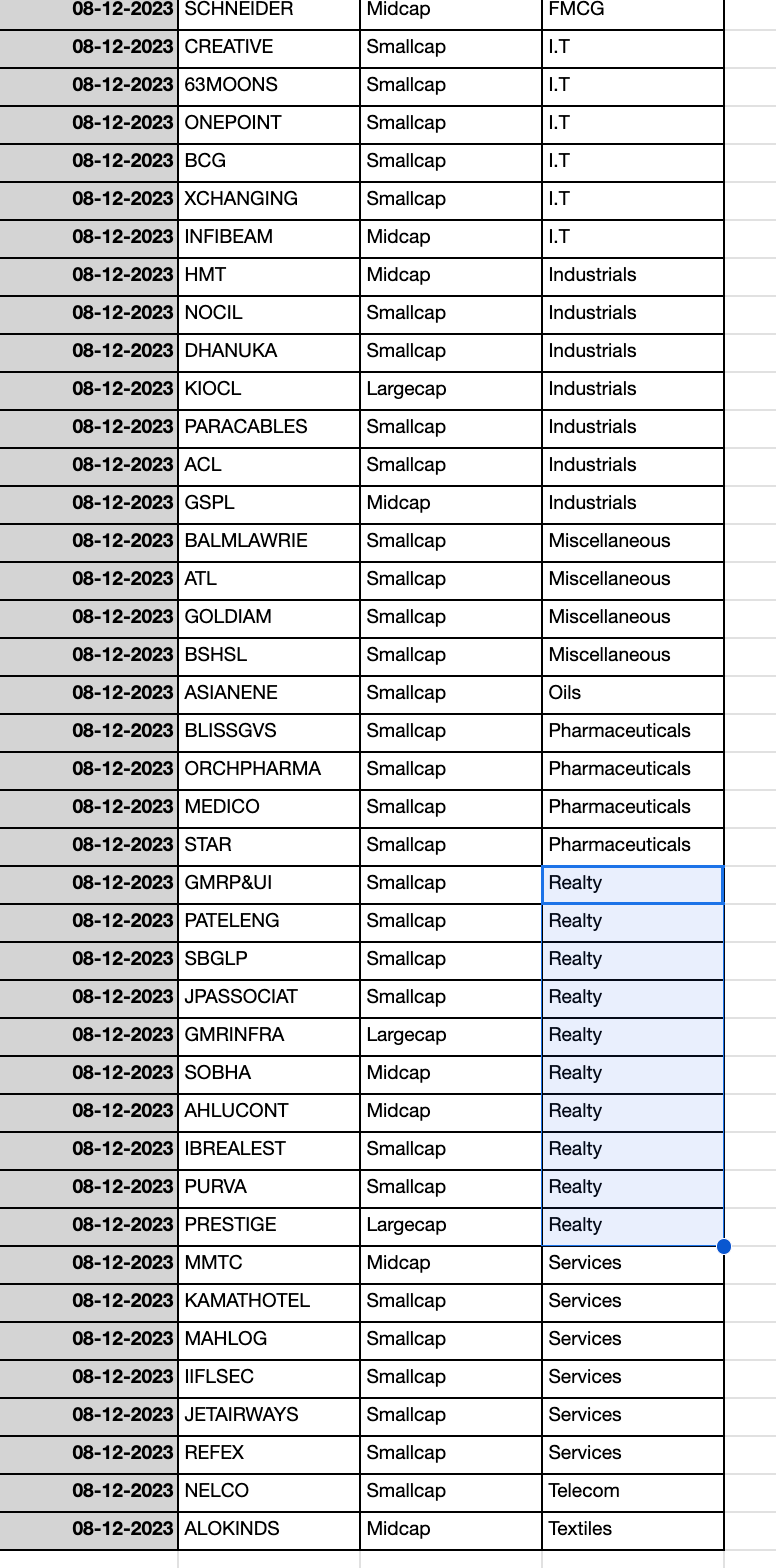
There are 55 names today.
You can also download the list to see the sectors.
what do you see?
I see Realty:
But this doesn't tell you about the %.
This isn’t good.
What % of realty stock made a move of 4% or more?
That’s the real sauce.
So ~16% of realty stocks (3rd column) made a >4% move. This isn’t very high but decent. Only media had more % of stocks that moved >4% today (~17%).
PS: A high fidelity metric better than >4% movers is the Net 4% movers (4% up - 4% down column 2).
Why?
Because a strong group will also have less number of -4% breakdowns.
The next question is: Is this a new strength or a continuation strength?
There are a couple of ways to answer this.
See % stocks that made Net >10% in a week?
Who tops?
Media and Realty. less goooo….
Meaning they are outperforming for at least a week.
What about before that?
For this, you have to run the scanner every day and develop a memory.
Remember, you aren’t looking for a quick fix, but a system.
A 5-day average of Net 4% movers will then tell you the general strength of the sectors.
From the figure below:
Telecom(Man City blue) and Realty (green) started outperformance with big spikes post-late October selling.
So these are continuation strengths.
While Media (deep Blue) is a recent strength.
Oil (purple/magenta) was strong before the late October beating and has started to show strength again.
You see.
The simple 4% data can be beaten up in so many different ways and presented to gain insights into group/sector/industry strength.
How did I find the Insurance and Fertilizers sector?
Well, chartink does not have a group called insurance.
And so I detected that manually.
For fertilizers, chartink does have an industry-wise classification and so a high % of chemicals with a net 4% jump told me that the sector is hot.
Similarly, you can also see which sector is the worst.
It’s Sugar today and so was yesterday.
How do I know?
I go through this scan every day mate, that’s how.
Summary:
To sum up.
(-)4% movers data is the primary data that tells you about the strength of the stock.
When looked at it, at a sector/industry level. It can tell you about the strength of that particular sector/industry.
Following this data every day/week will help you catch the START of a sectoral/industry move as well as the start of a sectoral/industry breakdown (sugars now).
That's all for today.
You can join the rapidly growing Homma community to shorten your learning curve and become consistently profitable as soon as you can.
The Beginners masterclass and Homma Private Access details are below:
The Sakatas Homma TA masterclass for beginners:
A monster course 8-10 hours. Hourly sessions on weekends. Twice a year.
Please register for the next batch using the link below.
https://docs.google.com/forms/d/e/1FAIpQLScfnQA1w9WDTtTAPEHIqzkS9jhRSZFA1BZXuWRZ5JPZ3Qfu8g/viewform
Watch my 1st session of the Autumn 2023 batch.
Homma Private Access membership:
HPA is a subscription-based educational service and community (on WhatsApp). Benefits include:
Daily Market Breadth, Momentum, Sector Rotation, and Relative Strength Update.
Access to all my scanners including the BBB (buy before breakouts) scanner (HTF scanner).
Access to my breadth-Momentum-Relative Strength & Sector Rotation dashboards.
Access to my Trading view indicators.
Homma Endgame.
Homma Triple B ultra pro max.
Homma Khela Hobe.
HPA Weekly: Hourly weekend deep dives and Q&A.
1-year access to The Technical Take premium.
Live updates on my portfolio and the trading setup rationale.
Access to my high probability watchlist (HTF watchlist).
Yearly membership of 12000/- INR only.
UPI payment & WhatsApp @ 9481506784.
Yours
Sakatas “4% movers rock” Homma.
Socials and Hommacommunity:
Keep reading with a 7-day free trial
Subscribe to The Technical Take to keep reading this post and get 7 days of free access to the full post archives.


