The Trendline Investor strategy
A simple positional systemic strategy to achieve steady longterm performance.
Hello aspiring peak trader.
Today I am going to distill one of the most simplest and effective positional strategy from the trendline investor.
An amazing teacher on top of being an awesome trader, his YouTube channel is a goldmine, and I would highly encourage you to check it out.
Now, notice I say “distill” and not “decode” or “breakdown” or something fancy like that. Simply because, his content is already simplified such that even a beginner can understand.
How do I define the Trendline Investor as a trader?
Trendline Investor is a peak techno-funda positional trader. He likes to buy fundamentally sound companies and hold them for atleast more than 3-4 months and catch larger portion of the uptrend as long as the trend persists. Hence he primarily uses the weekly charts for scanning but the daily charts for timing his entries and exits. His style is therefore suited to working professionals as he himself has a full time job.
As the name suggests, everything he does has to do with trendlines and channels.
Trendline Investor's set ups:
Everything Trendline Investor trades can be classified as either Breakouts or Reversals.
But the tool with which he identifies both, is the same i.e The CCI indicator.
Before going into the individual set-ups, let's discuss the only 3 tools/indicators he uses in his analysis. All 3 are freely available in tradingview.
3 indicators Trendline Investor uses:
The CCI (commodity channel index).
It is an oscillator indicator which show momentum and changes in momentum. The higher the value, the higher is the momentum. He uses a period of 34 (the default being 20).
The pivot HL.
This indicator gives you the swing high and swing low points on the charts. He uses the default settings of 10,10,10,10 (rarely does he use 5,5,5,5 for a short term trade)
Mansfield relative strength (by stage analysis).
This is an indicator which compares the relative performance of the stock as compared to any other instrument, in this case used to compare it to the broader market i.e Nifty 500. There are 2 plots, one is the relative strength plot and the other is the 52 week moving average of the RS plot itself.
Now let's discuss the 2 set ups one by one.
The Breakout set-up:
The Trendline Investor loves long term base breakouts. Longer the base the better. This can be a stage 1 base Breakout or a stage 2 continuation breakout.
A non negotiable aspect of his breakout trading is that, price should be crossing the previous weekly pivot high on the charts. This makes sense as he trades only stocks in an uptrend; and price above the previous pivot high means a new higher high signifying an uptrend, a central tenet of the Dow theory.
He uses a CCI based scan, CCI(34) crossing above 100 to hunt for these potential breakouts.
But not all of the names from the scan will be crossing the pivot high.
Out of those, that are crossing the pivot high with CCI breaking into bullish territory (above 100), he looks for the 3rd critical element in the set up, i.e the relative strength.
The entry is only triggered if the Relative strength line is above (or crossing) its 52 week MA.
To summarise the Trendline Investor Breakout strategy, an entry is triggered with:
price crossing pivot highs.
CCI(34) above 100.
Relative strength above its 52 week MA.
Stoploss generally goes below the swing low ie the pivot low or below a tight area around the breakout zone and is between 6-12% most of the time.
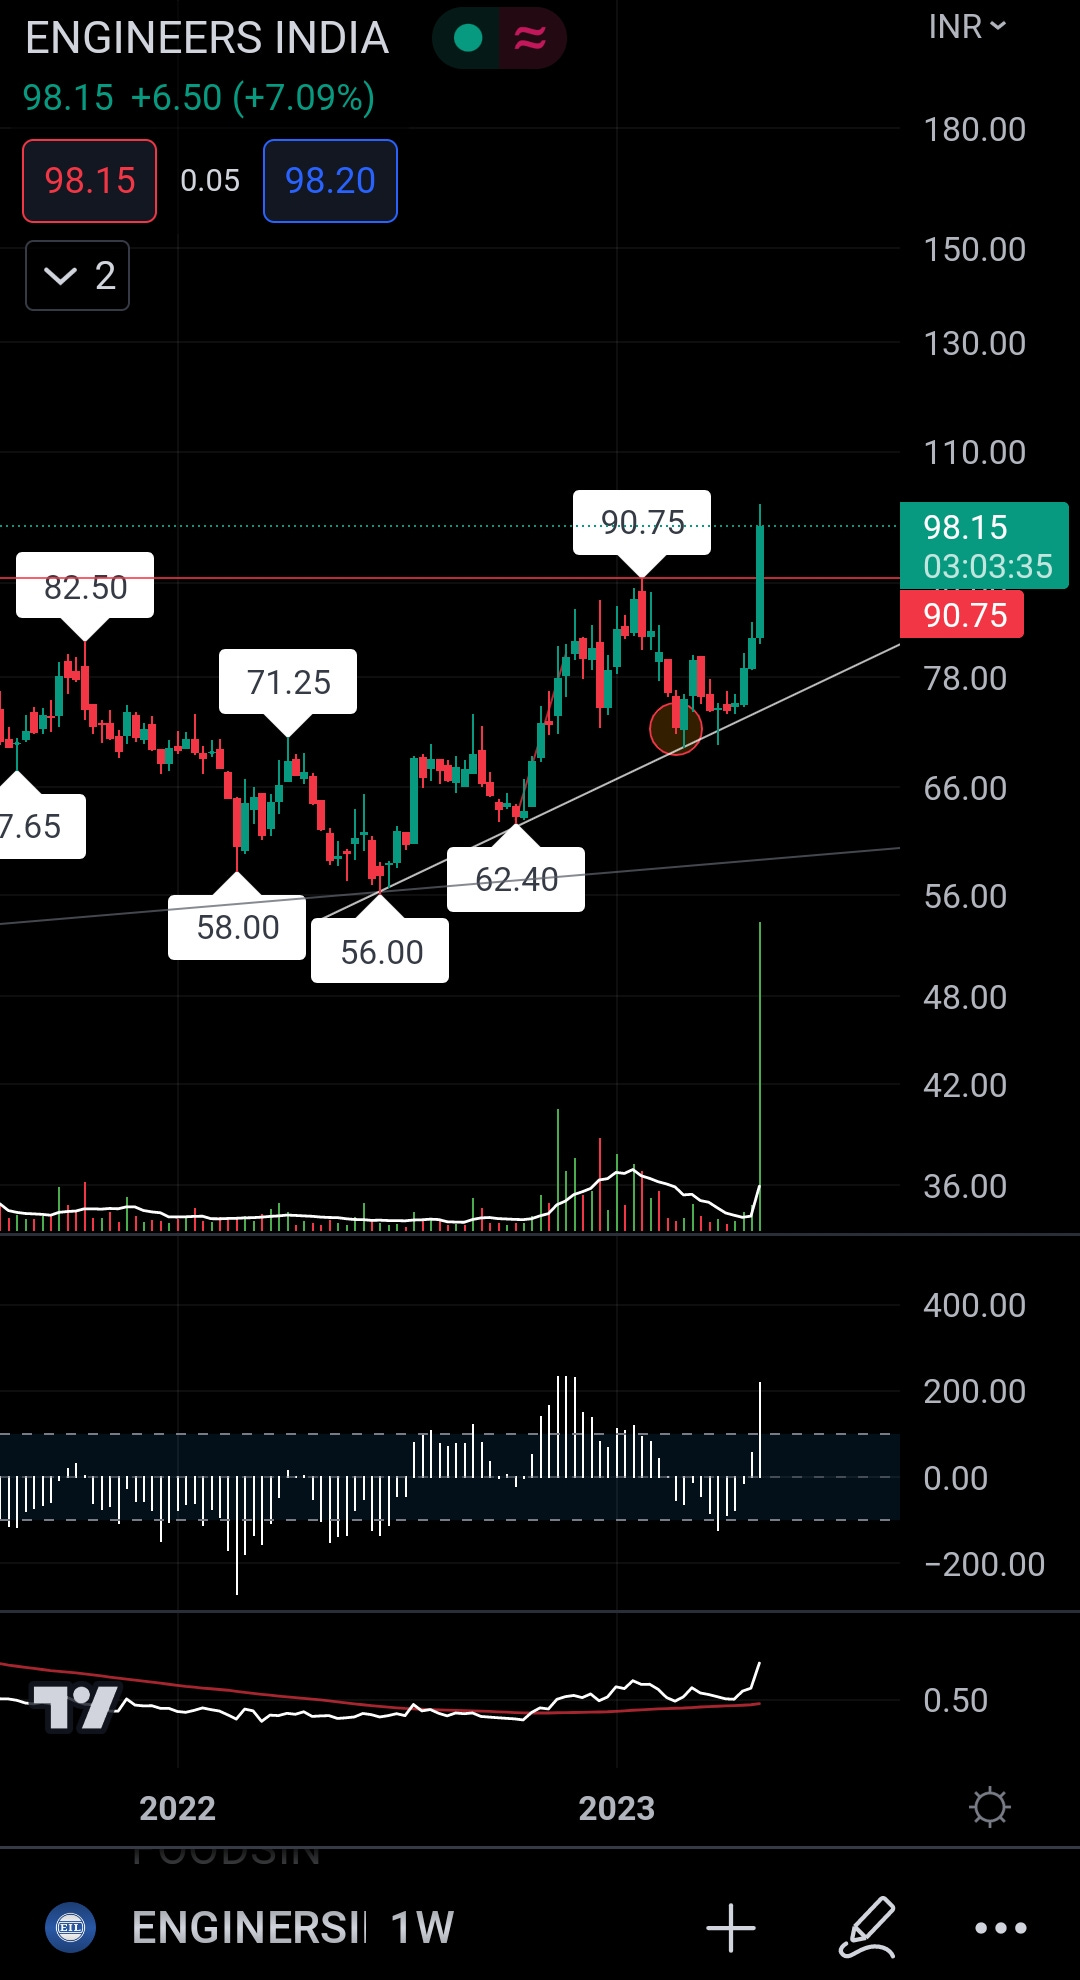
Example: EngineersIndia
A candidate which satisfies the breakout criteria right now in the market.
Weekly pivot breakout
CCI crossed above 100
RS above the 52 week MA
The Reversal set-up:
The Trendline Investor equally loves to trade a peak reversal set up. More often, reversals provides with a smaller risk. Almost all of his reversal trades are reversal from an Ascending channel.
The way he hunts for them is again by using a CCI based scan, CCI(34) crosses above -100.
He runs this scan on daily as often as in weekly.
Other conditions for a reversal candidate are the following:
Stock is NOT in a downtrend (in weekly timeframe), ie the low it made is higher than the swing low/pivot low.
The low is at a strong support zone. This could be a support of an uptrend line, a previous support zone, a previous resistance turned support, key MA support or a confluence of multiple of the above signals.
Bullish candles: bullish candle sticks with long lower wicks, or bullish candlestick patterns like bullish tweezers, bullish engulfing, morning stars etc. are added confluences.
When all these conditions are met, a reversal entry is made on the breakout of pivot high (at a smaller timeframe) with SL below the swing low. The risk is generally less than 5-8% of buy price.
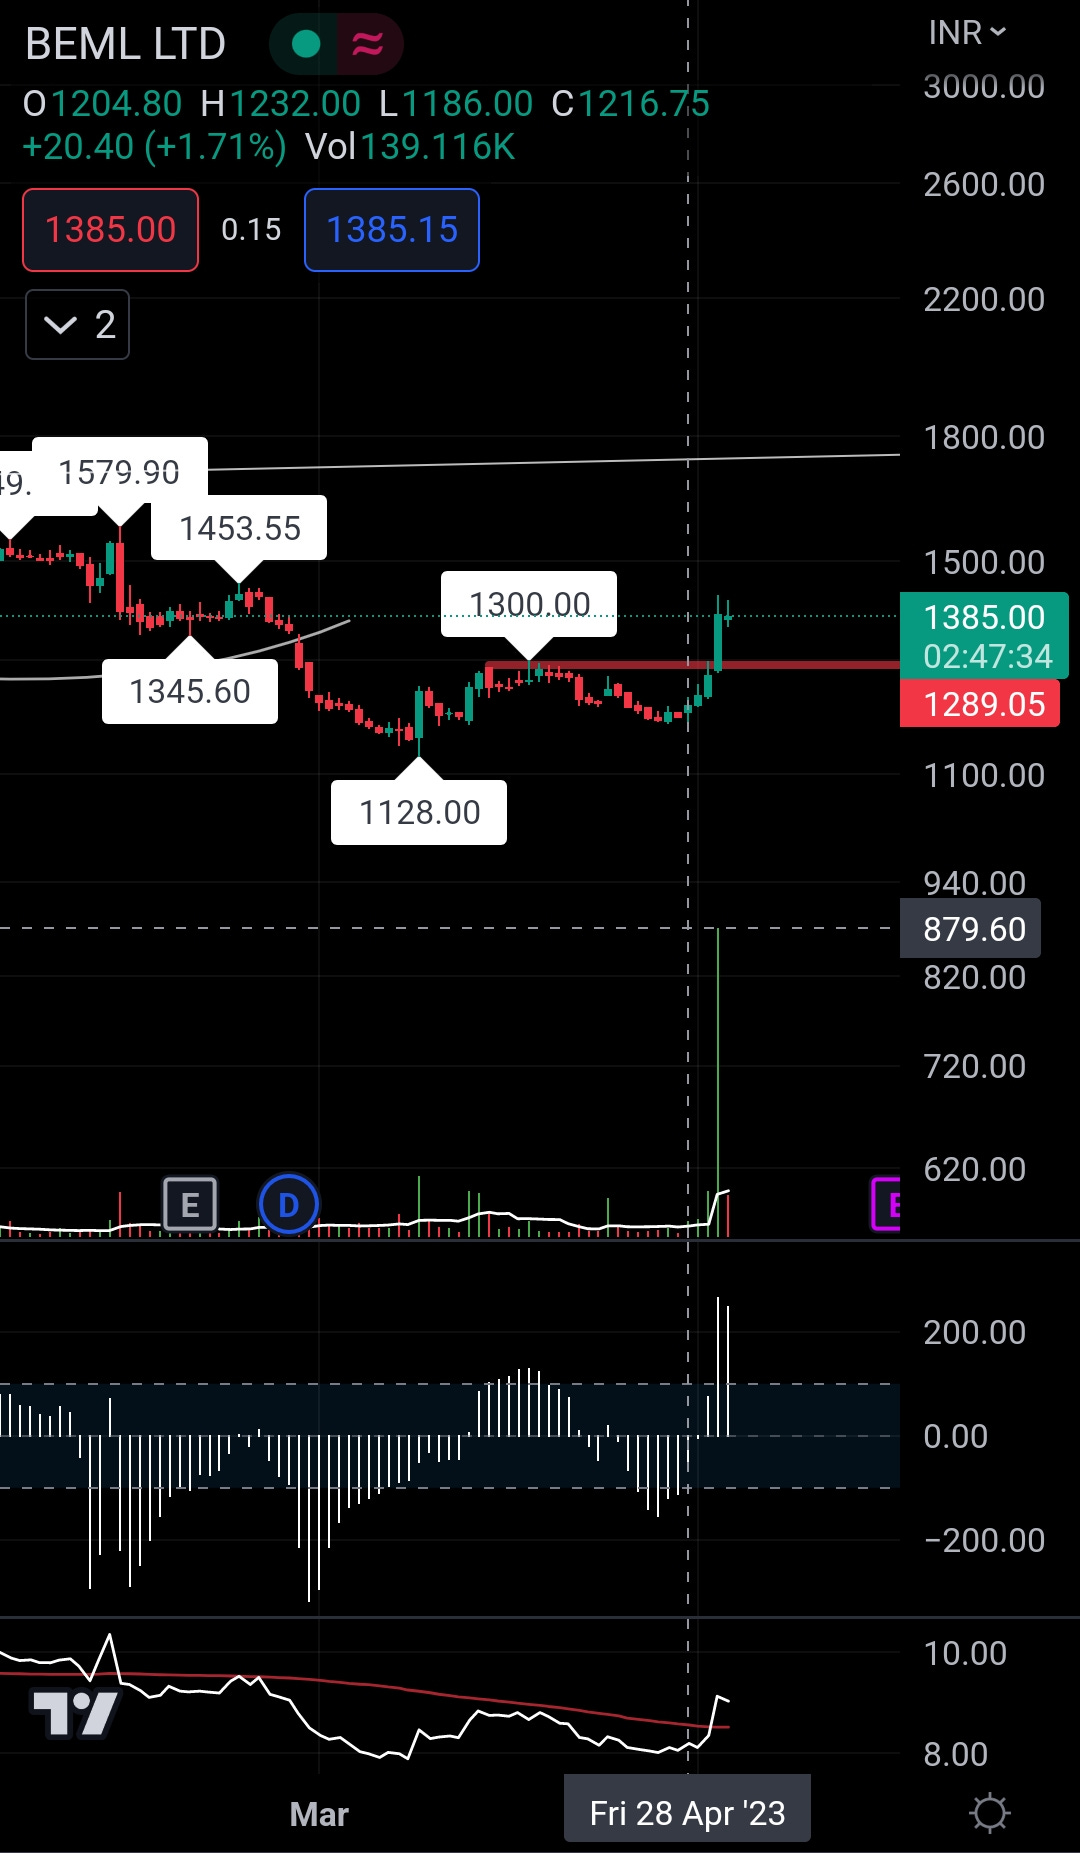
Example: BEML
CCI(34) both daily and weekly gave a reversal signal around 27-28th April.
Price was above the weekly swing low.
Notice the RS cross over the 52 MA as well on the breakout candle which came on May the 4th.
Weekly chart.
Fundamental checks:
As he is a Techno-funda investor, there are a few fundamental quality checks he runs before buying a stock. These are:
Low debt: Debt to equity ratio less than 1.
Steady increase in sales and earnings.
Stable or increasing operating profit margins.
Exits:
The trade is exited using signals on a daily chart. Most often at the cessation of the uptrend at the break of the previous swing low.
That's all for this weekend.
If you liked the article, you will definitely like the Trendline Investor's content even more.
Follow him on twitter and YouTube.
Follow me on twitter as well if you haven't already.
(I am writing the article on my mobile and somehow having trouble to link the address to the socials. Will drop them in the comments)
I am writing my own version of both the breakout and reversal scanners based on this set-ups I discussed which I will share on twitter soon. So don't miss it.
Untill next weekend,
Keep learning
~ Homma.


Trendline investor Twitter: https://twitter.com/dmdsplyinvestor?t=60aQnnCHGZWjjeoHjZQ3rw&s=09
Trendline investor YouTube: https://youtube.com/@TrendlineInvestor