THE SIMPLEST BREADTH INDICATOR to visualize MARKET TREND
% stocks above the KEY moving averages
“Markets can remain irrational longer than you can remain solvent.” ~ John Maynard Keynes
The indices have been rangebound for more than a month now.
Every time it comes near the resistance and tries to break out, there is a slight dose of FOMO.
Every time it comes near support and tries to break down, there is a grip of fear.
But, the indices do not paint a complete picture (you should know this by now).
Therefore looking at the whole market breadth is the wisest thing to do.
Today, I am going to discuss the simplest Breadth indicator one can use.
I will also show how I used it to anticipate the recent bottom.
{Link to the Breath indicator at the bottom}
% stocks above the KEY moving averages:
Which are the key MAs?
They can be anything.
The most widely used are 20SMA for short-term (some use 10 SMA as well and thats fine). 50 SMA for medium-term and 200 SMA for long-term.
Now calculate the % of stocks that are above each of these MAs.
A plot of this (see images below) is the simplest graph that can tell you the health of the market.


Below is a composite graph for % stocks above all 3 key MAs with a Nifty500 composite chart. Let’s see what the graph can tell about the breadth and market condition:
These are my observations:
In any timeframe, a value above 50% and rising means bullish and a value below 50% and dipping means bearish.
Extreme values of near 100 or near 0 for a prolonged period of time might signal an impending Top or Bottom and that a reversal could be anticipated.
for eg. the readings in June 2022 went till 10% for all MAs after which we saw a bounce.
Trend change happen when the indicator crosses 50 (from above or below). This will be first visible in the shorter MA and will show in the higher timeframe MA if the trend gets stronger.
For eg: the bullish reversal after March 2023 lows was first signaled by the 20 MA which was then followed by 50 and 200.
The 3 timeframes need to be read together and not in isolation.
For eg. although the 20 and 50 MA is making lower highs and lower lows (which signals that in a short and medium timeframe, market is losing the uptrend momentum), the 200 MA is still making higher highs and therefore is in an uptrend in a larger timeframe.
The bullish to bearish transition will also be signaled by the short-term MA first. In the present scenario, if markets were to breakdown, the 20 SMA will be the first one to cross below 50.
Divergences if read accurately are useful tool that can help in anticipating the Tops and Bottoms.
This is an important point and perhaps a higher level reading. I will try to give one example of this below.
Recent Bullish Divergence with Nifty50:
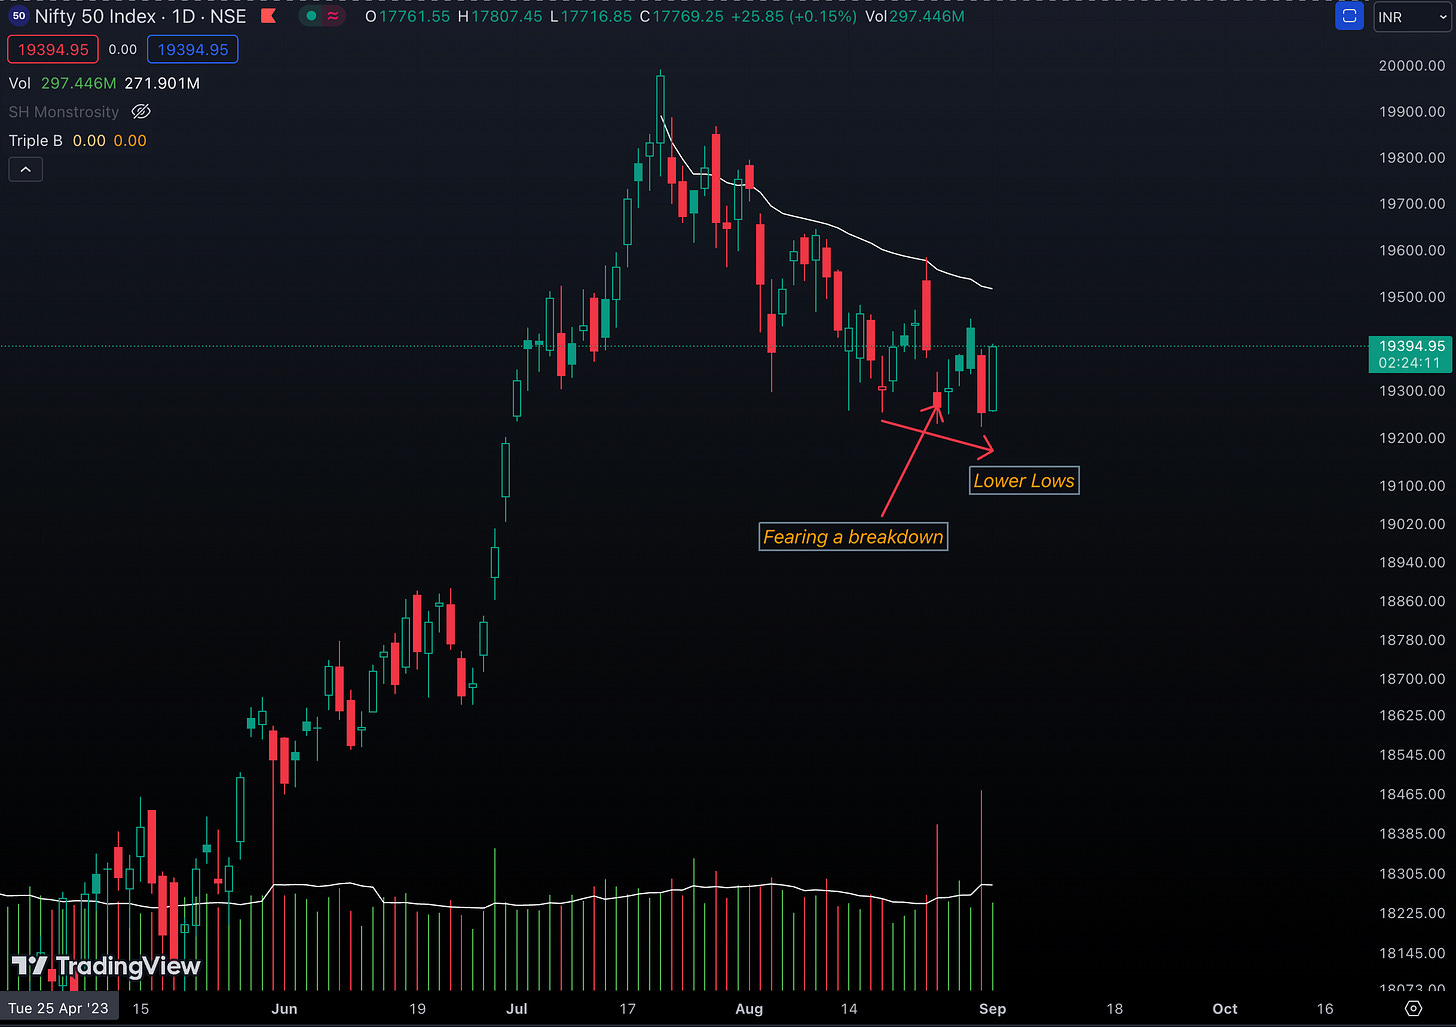
Nifty 50 making lower lows
20, 50 and 200 making higher lows.
Last Friday (25th August 2023) was a big red day when the indices gapped down and closed at the lows. There was a general panic and calls of a breakdown.
While the breadth indicators were making a higher low (see 20 SMA made a low around 50 which was higher than the previous low of 45 made on 17th August). This is basically a Bullish divergence. This signal was the primary reason for me to not panic (I use it in concert with other breadth indicators).
(divergence trading is not as simple as I am showing in this example, but they can certainly be helpful as confirmation signals when used along with other breadth indicators)
To recap, TLDR:
Breadth indicators > index.
% stocks above key MAs (20, 50 and 200) is the simplest breadth indicator.
A value of 50% or above means a bullish environment and vice versa.
Breadth should be read with a multi-timeframe approach and not in isolation for a single timeframe.
Divergences can be useful in hunting Tops and Bottoms (not that you have to hunt them).
That’s it for today man (Friday, you will read this only on Saturday).
I am nervous and excited for the Masterclass which starts today. (let me know if you wanna drop by for the session on breadth).
It will be fecking amazing.
Hope to see some of you there.
Cheers.
Sakatas “Less Go” Homma
Here is the link to the breadth indicator:


