Read to gain knowledge, but make your own observations as well.Dear Aspiring Peak Trader,
Today I will discuss the most abused concept in trading and technical analysis. “Breakouts”
Not just that, but the wildest and most bullish of them all, the bullish on Bullish breakout.
In this article, I will tell you:
What is a breakout?
What is BOB breakout?
The BOBs to avoid (William O Neil says so).
Past and live examples.
So what is a breakout?
A breakout is a price action where the price leaves a well-defined area (or a range) that it had previously been populating for a period of time.
This well-defined area can be a horizontal range, in which case the price would be consolidating i.e. moving sideways inside a base. Or,
The area can also be sloping up, in which case the price would be traveling inside an ascending channel.
Bullish on Bullish breakout:
Breakouts from an area with a positive slope (ascending channel) are called Bullish on Bullish breakouts.
As the name suggests, this bullish breakout is occurring on an already bullish price action (ascending channel) which makes it more powerful.
The BOBs to avoid?
Stocks move in a cycle consisting of 4 stages (since you read the Technical Take, I assume you know that already. If not, go and browse previous articles. Right now):
A BOB breakout is most likely to occur in 2 different stages of the stock cycle:
Late Stage 1 (early stage 2):
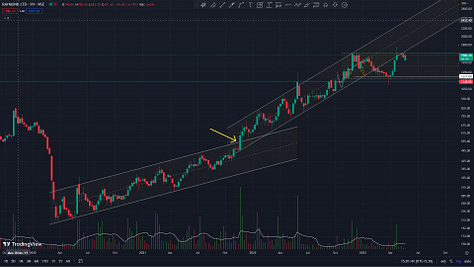
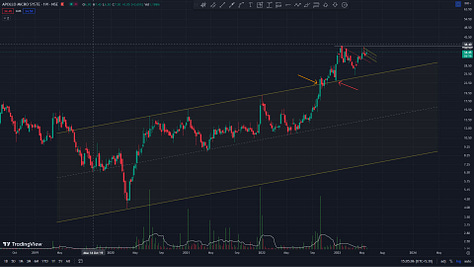
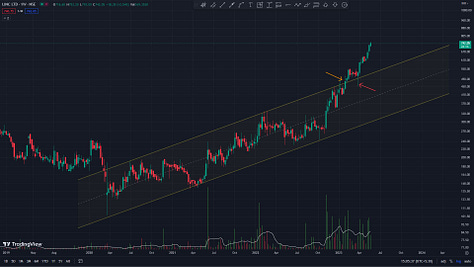
Price after a flattish stage 1, starts to move up inside an ascending channel (AC). This AC will have a smaller slope which shows that the momentum is picking up from a flat stage 1. Further market participation in the move leads to an increase in momentum, and price gives a BOB breakout. This is a type I BOB breakout. Most often than not, the price retests the resistance (now turned to support; see an example of this in Apollo Microsystems) and charts a new Ascending Channel for itself with a higher slope than the previous AC and continues stage 2 further (see an example of this below in Raymond).
Late Stage 2/ Early Stage 3:
After a considerable up move from the stage 1 primary base (~>100% return), the stock now is at a late stage 2; looking to transition into stage 3 and start the distribution phase. Stage 2 can persist for a long period of time but to be safe anything above 9-12 months from the stage 1 base can be considered a late stage 2 now. Distribution often starts with a climax buying move (exhaustion gaps occur around here very frequently) which leads to climax exhaustion. At this point, you are likely to see a BOB breakout again. This is the type II BOB breakout. This is also the kind of price action where William O’Neil encourages you to sell the stock once you have caught the majority of the stage 2 move.
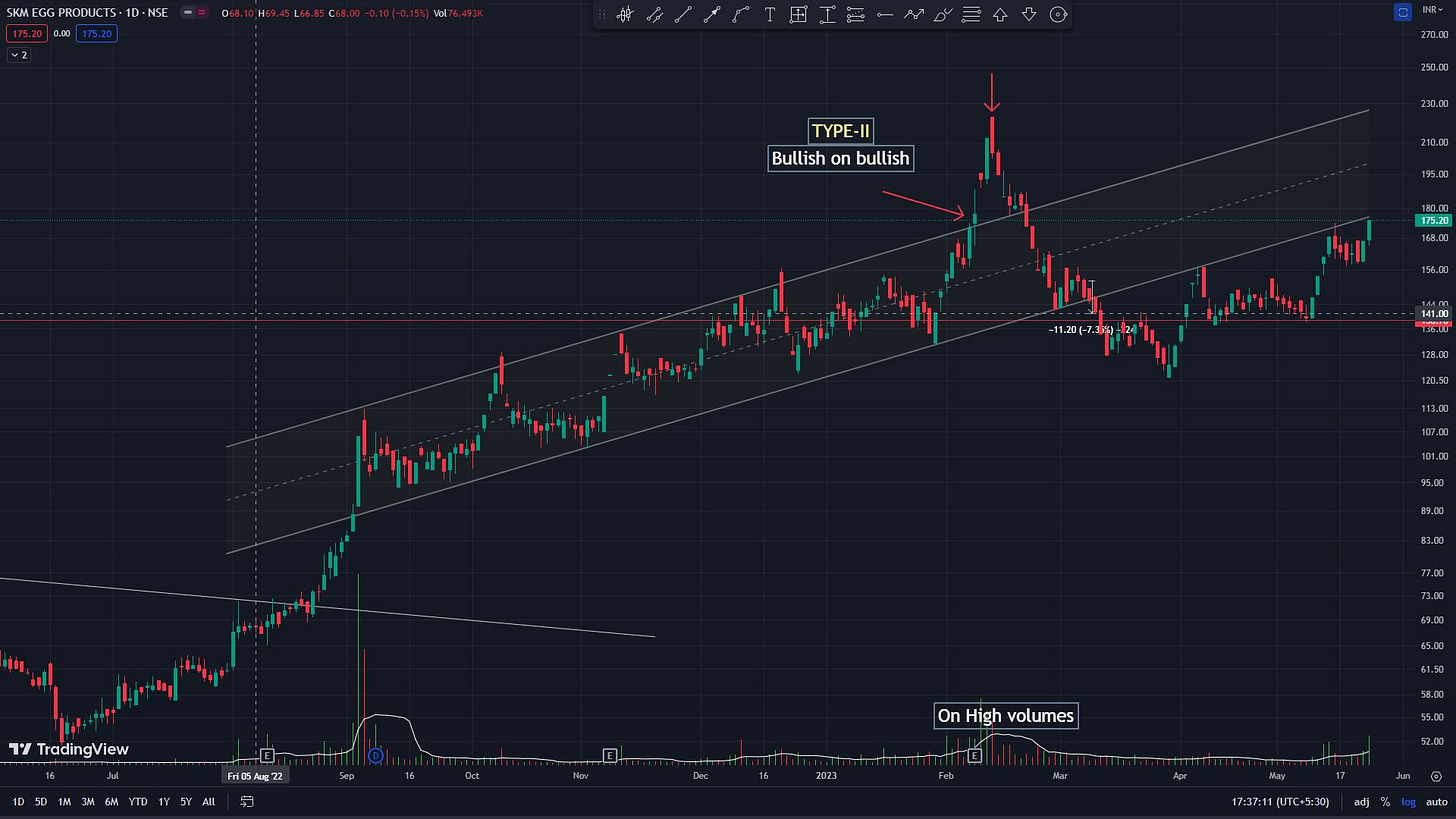
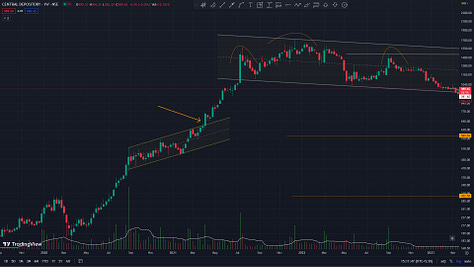
Type II BOBs are dangerous. They are unlikely to sustain and there is a high probability that the price after BO will come inside the AC again, going into a sideway consolidation or eventually breaking down.
An example of this type II BOB is SKMEGG (figure below)
Difference between Type I and Type II BOB:
Type I occurs at the beginning of the stage 2 phase whereas type II occurs at the end.
Type I occurs near a long-term consolidation base (the Stage 1 base) while type II occurs at the top of a prolonged Stage 2 up move (often > 100% moves) away from the Stage 1 base (9-12 months away).
Type I BOB is not followed distribution(selling) candles while type II BOB will be followed by distribution signals like high volume doji/shooting star/bearish engulfing etc.
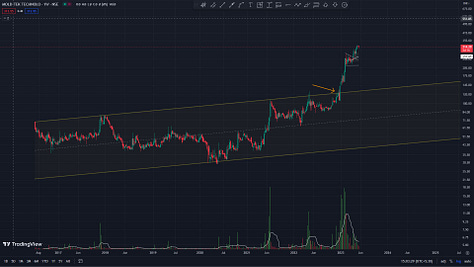
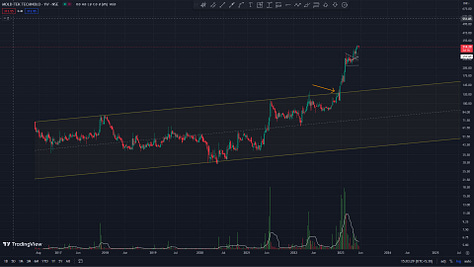
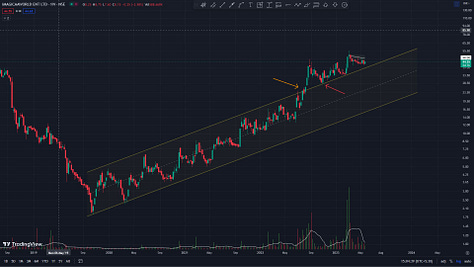
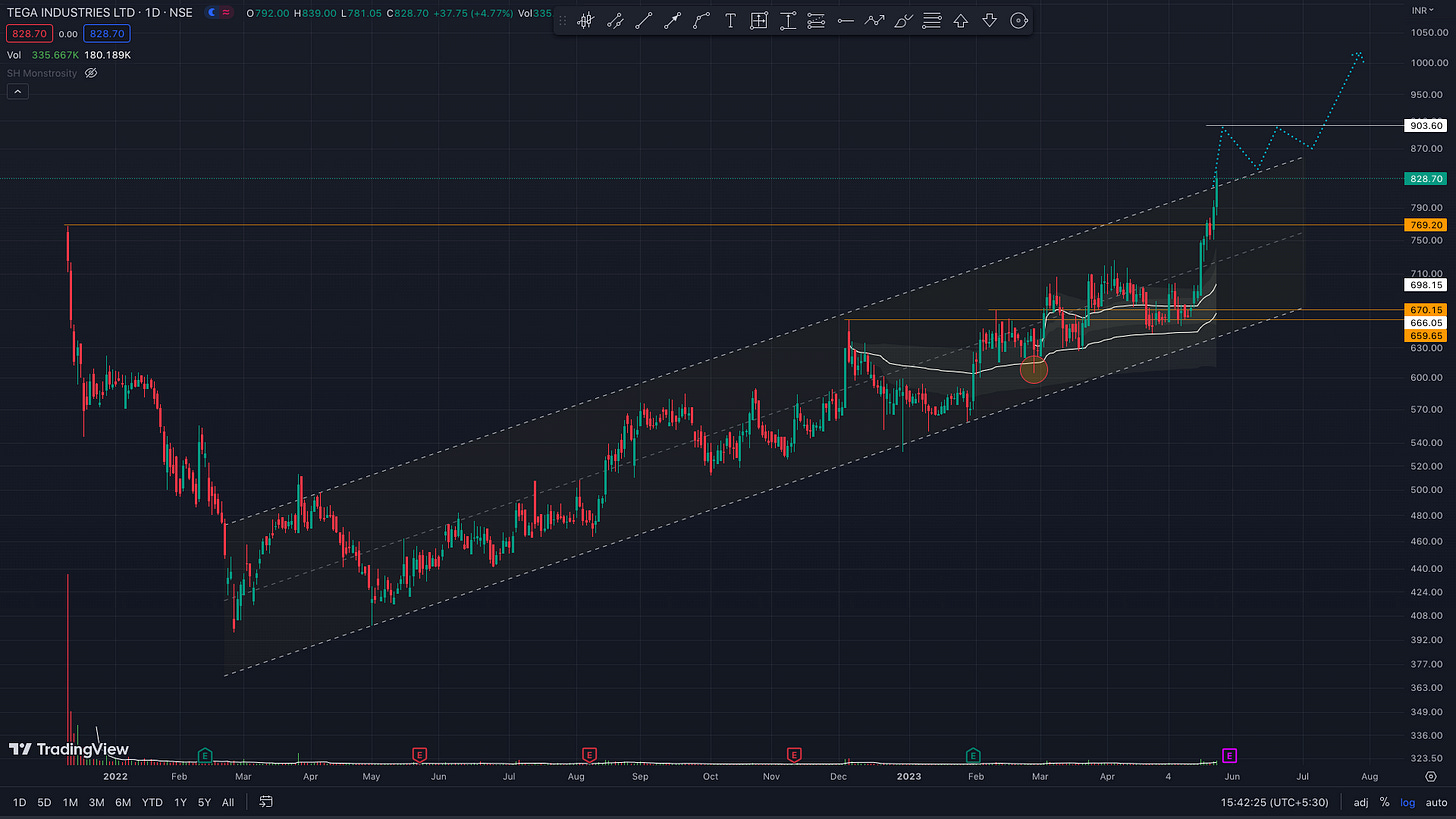
Past examples of Type-IBOB breakouts:
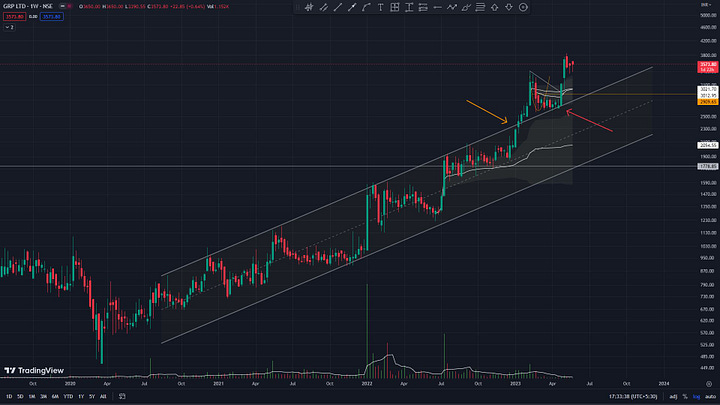
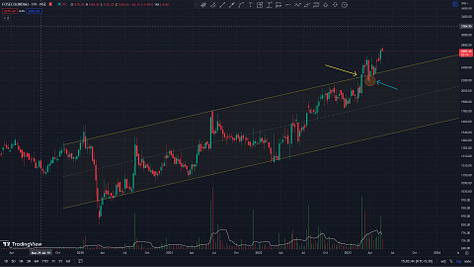
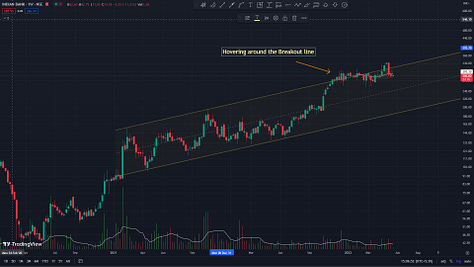
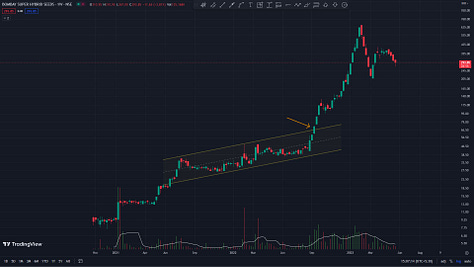
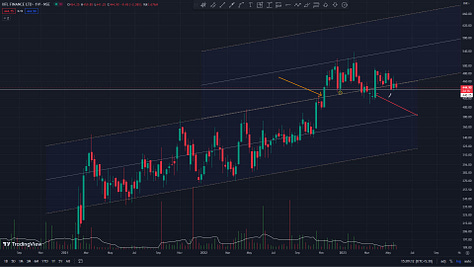
Below are some examples. From this list, you will notice that BOB as a price action can occur in any timeframe (fractality of the markets). Some retest (red arrows) after the breakout, while some just don’t.









Sakatas Homma exists to share all and any trading-related information and data with any beginner who wants to learn how to trade for free. Furthermore,
Whenever you are ready, I can help you level up your trading in the following ways:
Sakatas Homma TA masterclass for beginners:
A monster course (12-15 hours total). Hourly sessions on weekends. Twice a year. Please register for the fall 2023 course using the link below.
https://docs.google.com/forms/d/e/1FAIpQLScfnQA1w9WDTtTAPEHIqzkS9jhRSZFA1BZXuWRZ5JPZ3Qfu8g/viewform
Sakatas Homma Academy membership:
This is a subscription-based private access educational service, where you will learn about my trading style in real-time, my watchlist and set-ups, & my process overall.
You can either avail a monthly or a yearly membership. For more details, WhatsApp and UPI payment @ 9481506784. Early bird offer, 50% off on the 1st-monthly subscription.
This is all for this weekend,
I will see you in the next one. Till then,
Don’t stop asking those stupid questions.
~ Homma
Some Peak Scanners for you:
High Tight Flag: https://chartink.com/screener/copy-shhtf
Pullback to 10/21 ma: https://chartink.com/screener/copy-shpb1021
BCP (long-term timeframe): https://chartink.com/screener/shvcp-epic-modified


