What a week! like honestly.
I never imagined seeing such a massive fall in a group of stocks to this extent.
Cutting straight to the chase
Have the Adani Stocks bottomed?
Is the market bottomed? Will there be a post Budget rally?
In this article, I will try to answer the above questions with the help of technical analysis.
Friendly disclaimer that, none of the predictive analyses might work out to be true. All bottoms are spotted in hindsight, but as technical analysts, we try nonetheless to the best of our capabilities.
Before jumping in, check out my thread on the Adani group just before the fall when the narratives were sky-high. The last lines of support were clearly marked for exits.

Adani Enterprises:
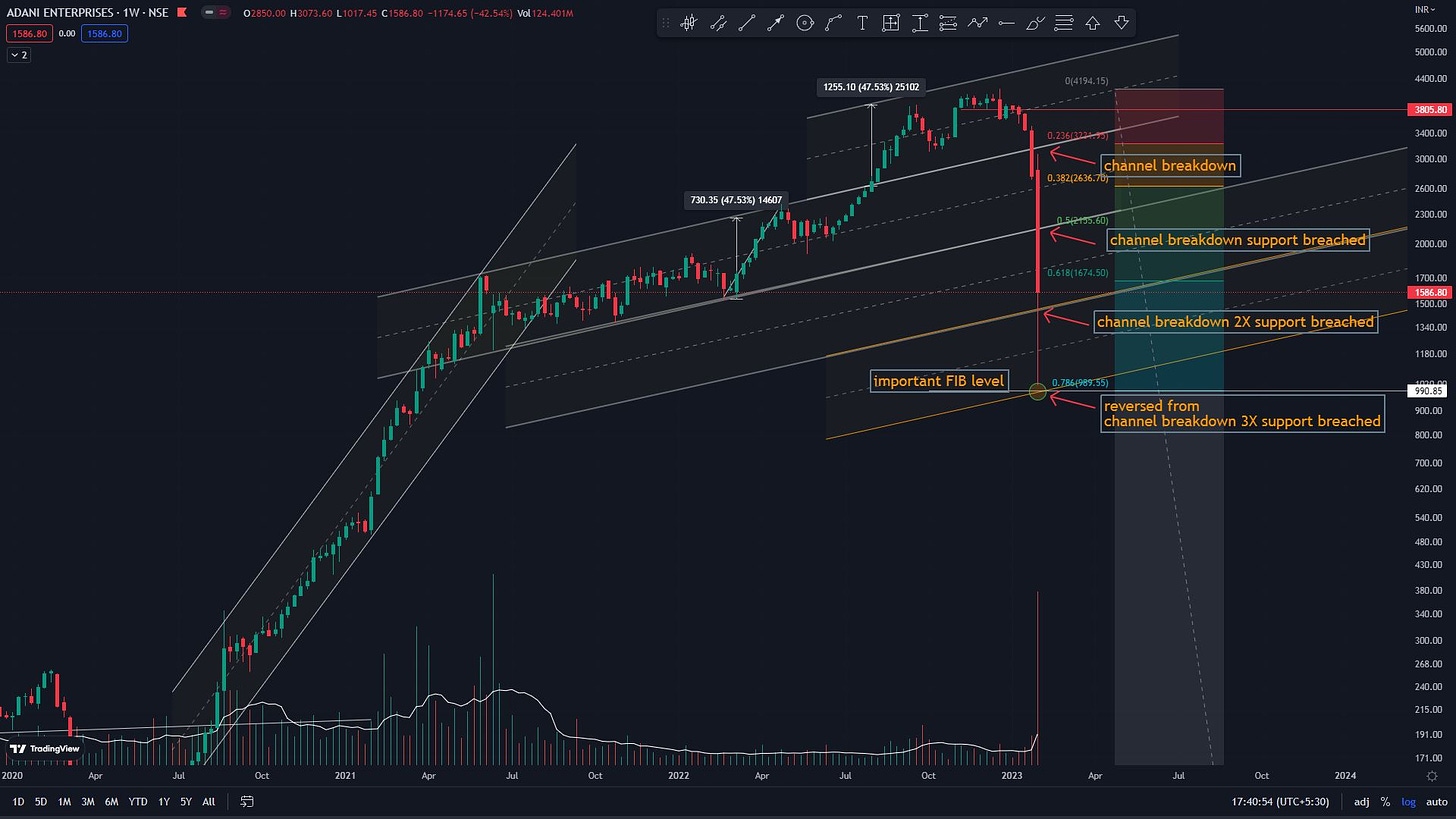
Had a fantastic journey. A 60° Ascending channel (AC) morphed into a 45° AC and eventually broke out from this channel as well.
Breakdown of which was nasty.
Price is now at the 3X channel breakdown target and at an important Fibonacci level.
These imaginary channels can act as support resistance going forward. A bottom appears to be made.
2. Adani Green:
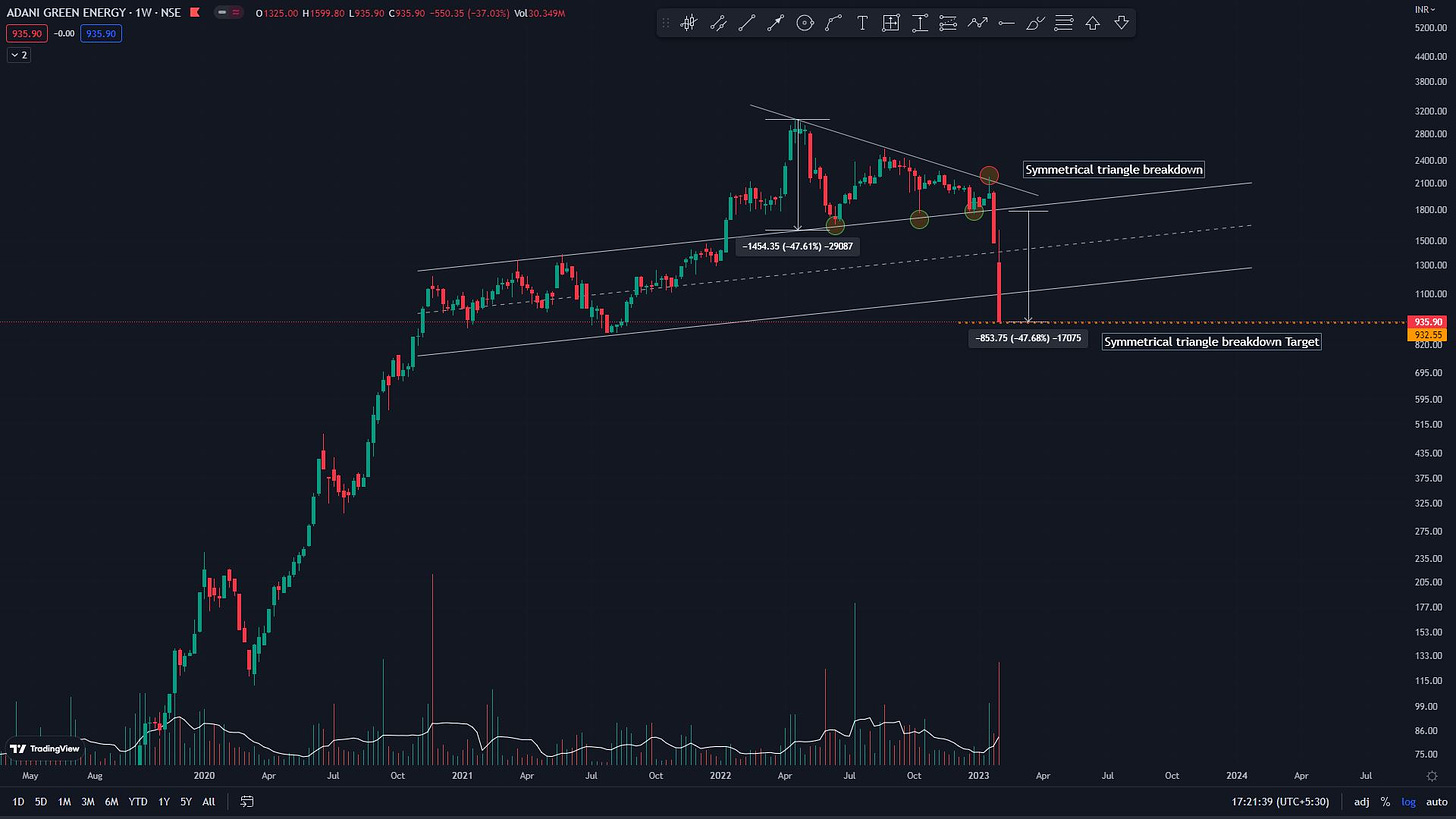
Formed a symmetrical triangle top and price broke down.
price reached the pattern target.
Could be a bottom, but no signs of reversal yet.
It’s not advisable to catch a falling knife.
3. Adani Trans:
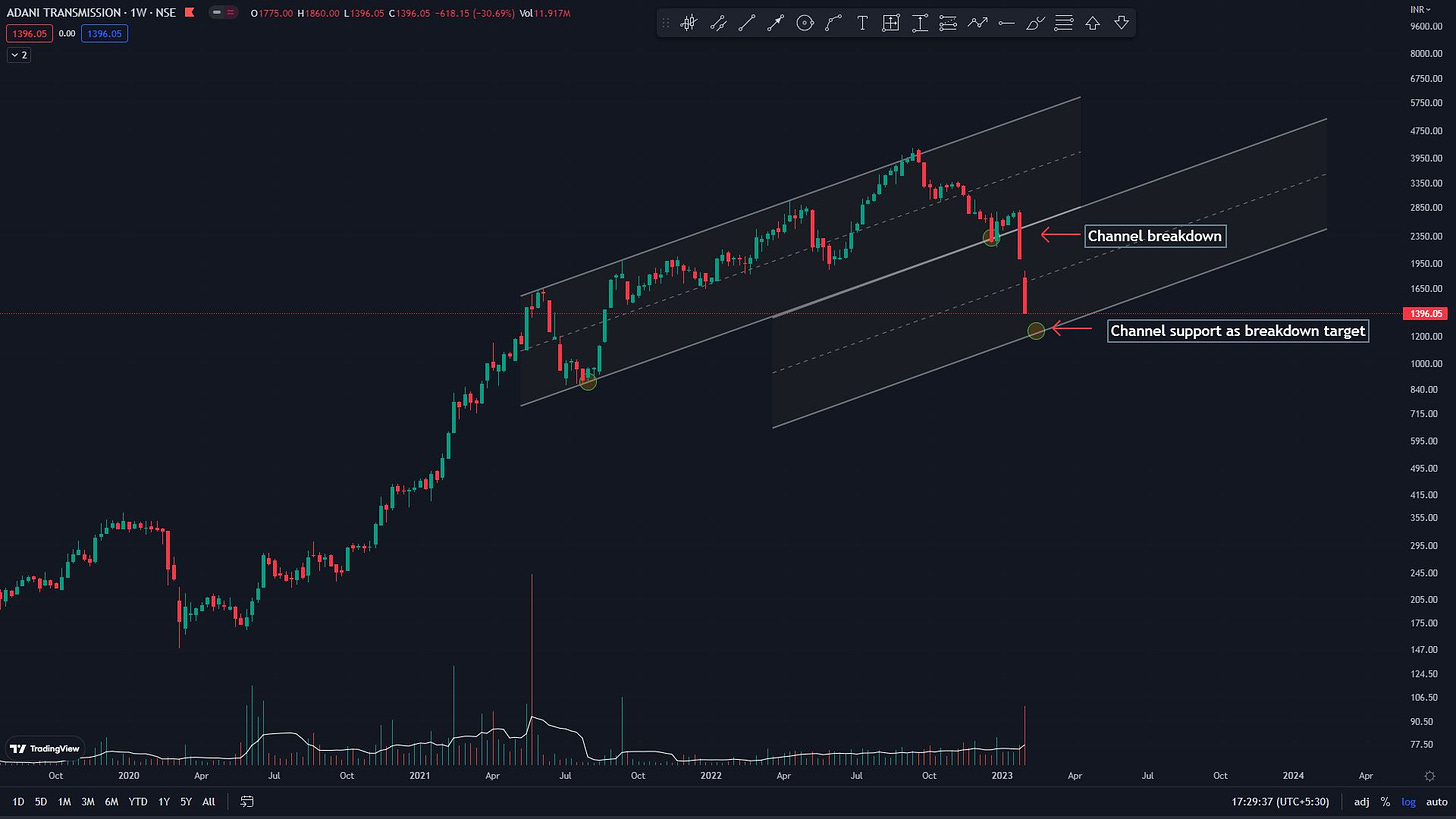
A simple breakdown of the 45° ascending channel.
Price moving towards the pattern target.
No signs of reversal yet.
4. Adani Ports:
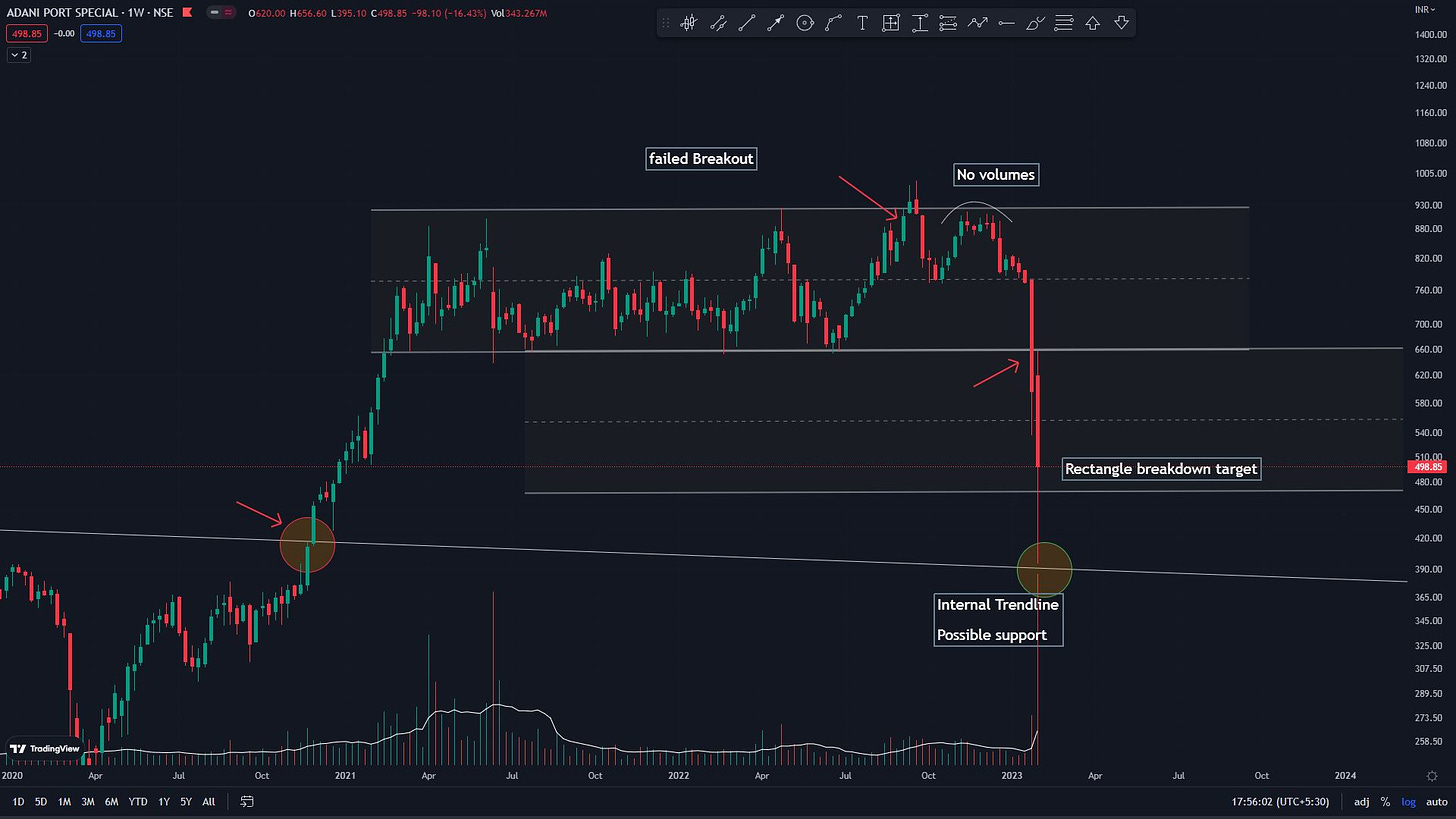
A classic breakdown of a rectangle pattern.
Price reversed from the internal trendline, a prior resistance turned support now.
looks like the bottom is in.
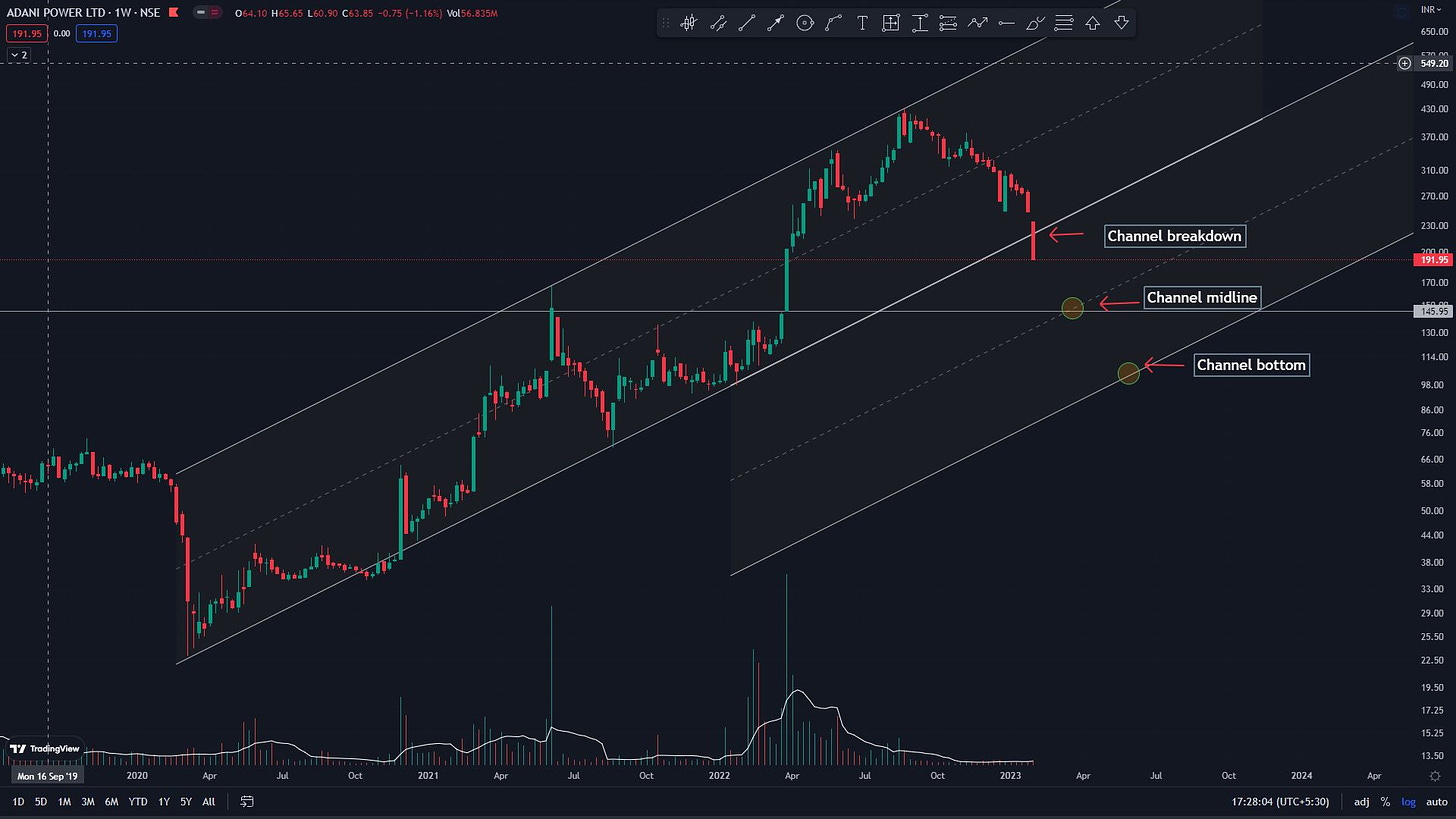
5. Adani Power:
Breakdown of the big ascending channel.
Possible pattern targets marked.
More downside is expected.
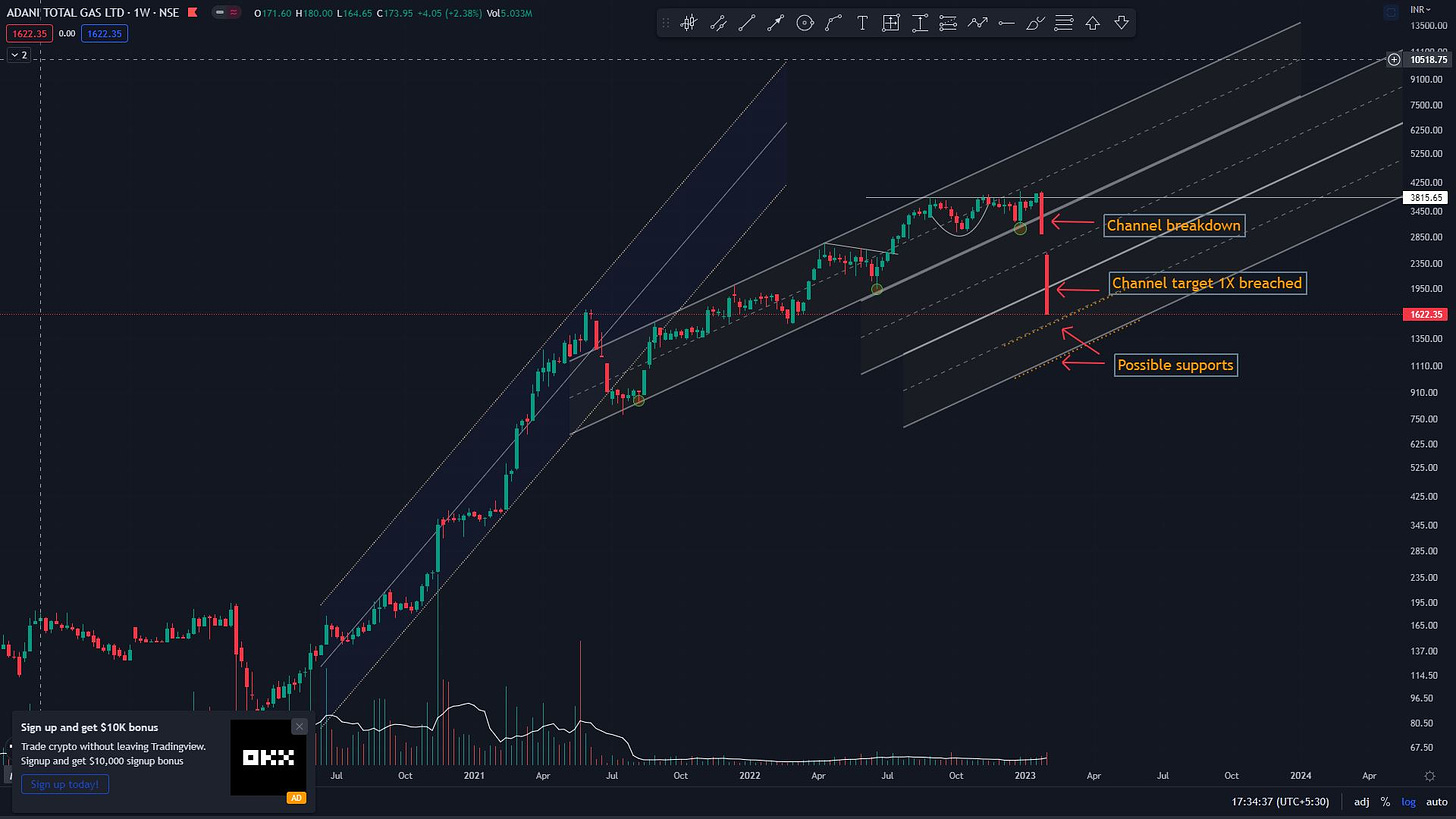
6. Adani Total Gas Limited:
Trend change is seen as the price moves from 60° AC to 45° AC eventually breaking down.
1X pattern target breached effortlessly and is now falling towards the 2X pattern target.
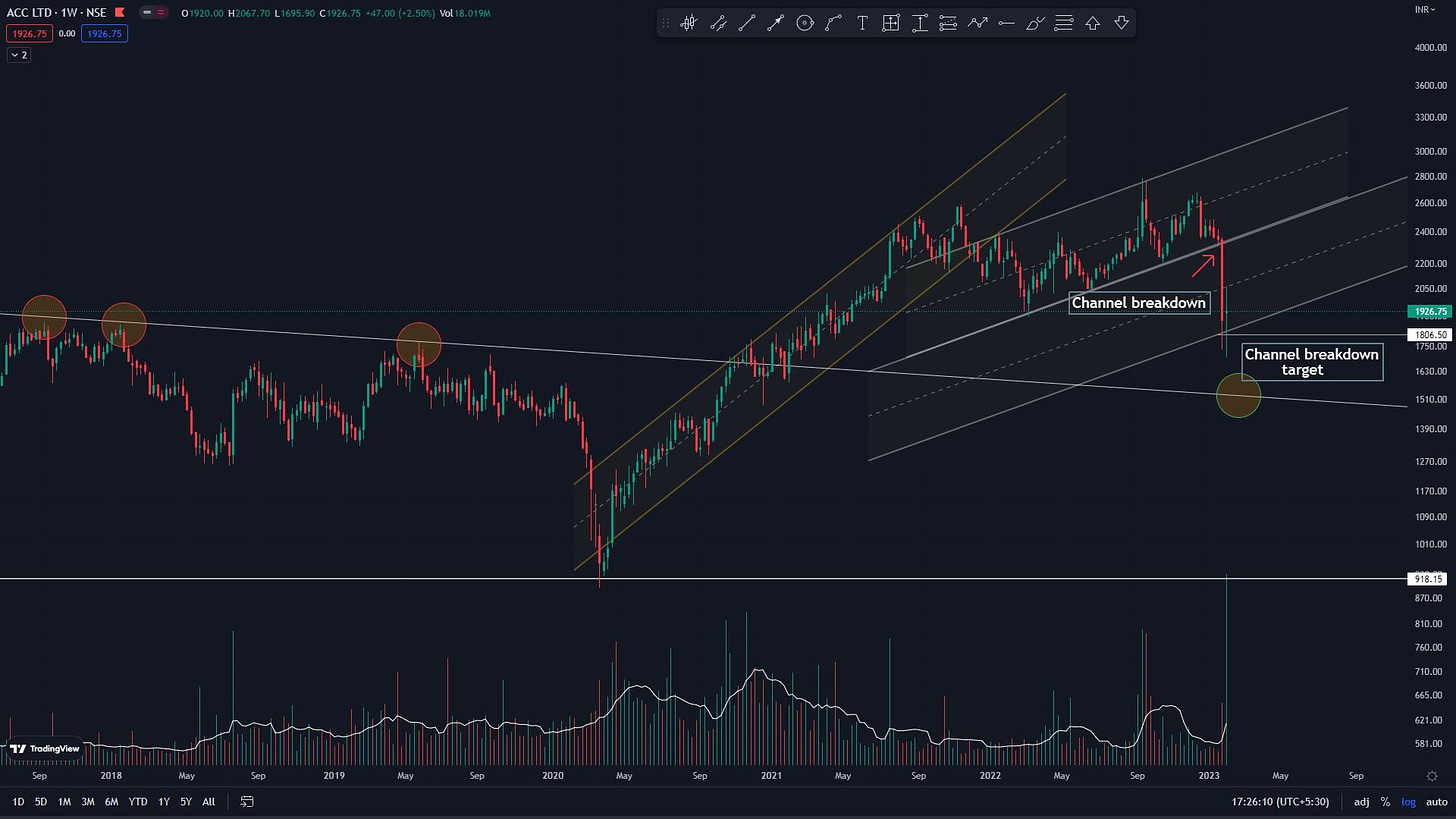
7. ACC:
Similar to ATGL, a trend change is seen as the price moves from 45° AC to 30° AC eventually breaking down.
1X pattern target is holding at the moment.
Long wicks showing good demand, it could turn to be a bottom.
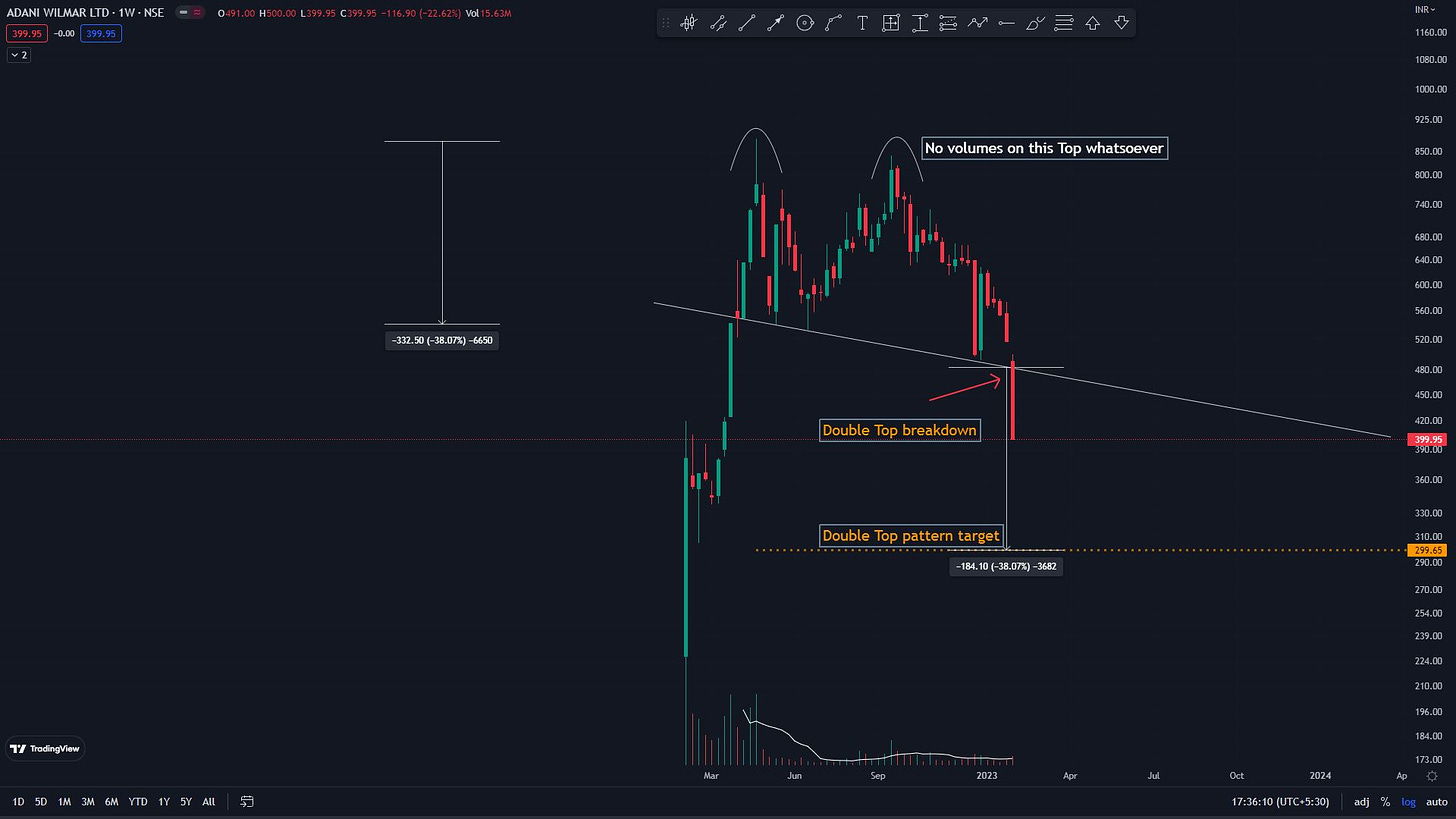
8. Adani Wilmar:
Massive double top breakdown and the breakdown targets marked.
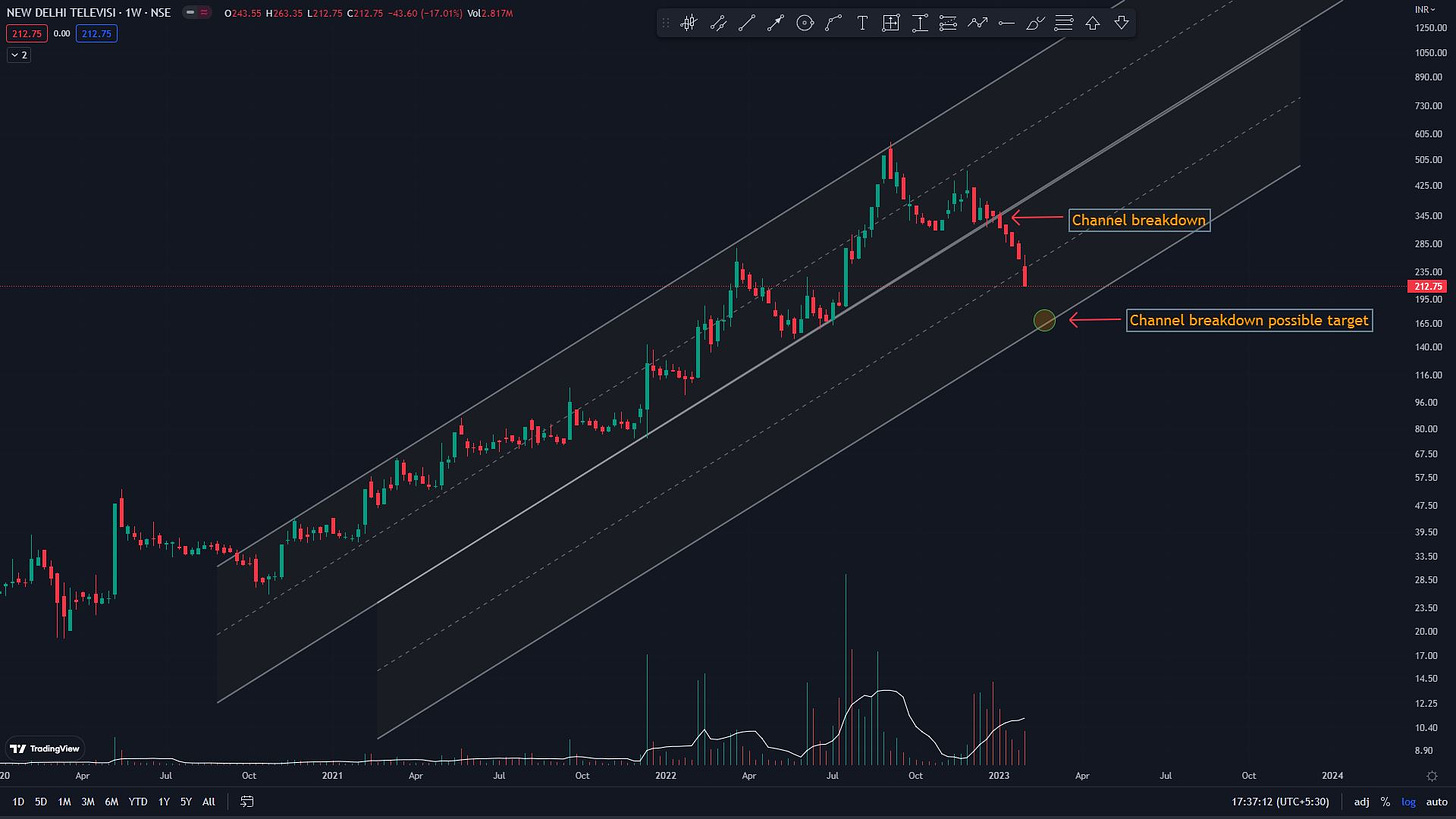
9. NDTV:
Breakdown of an ascending channel and price moving towards the target.
The whole support line of the channel can act as possible support.
Now coming to the Indian Markets as a whole, today’s close gave a decent look to the weekly candles.
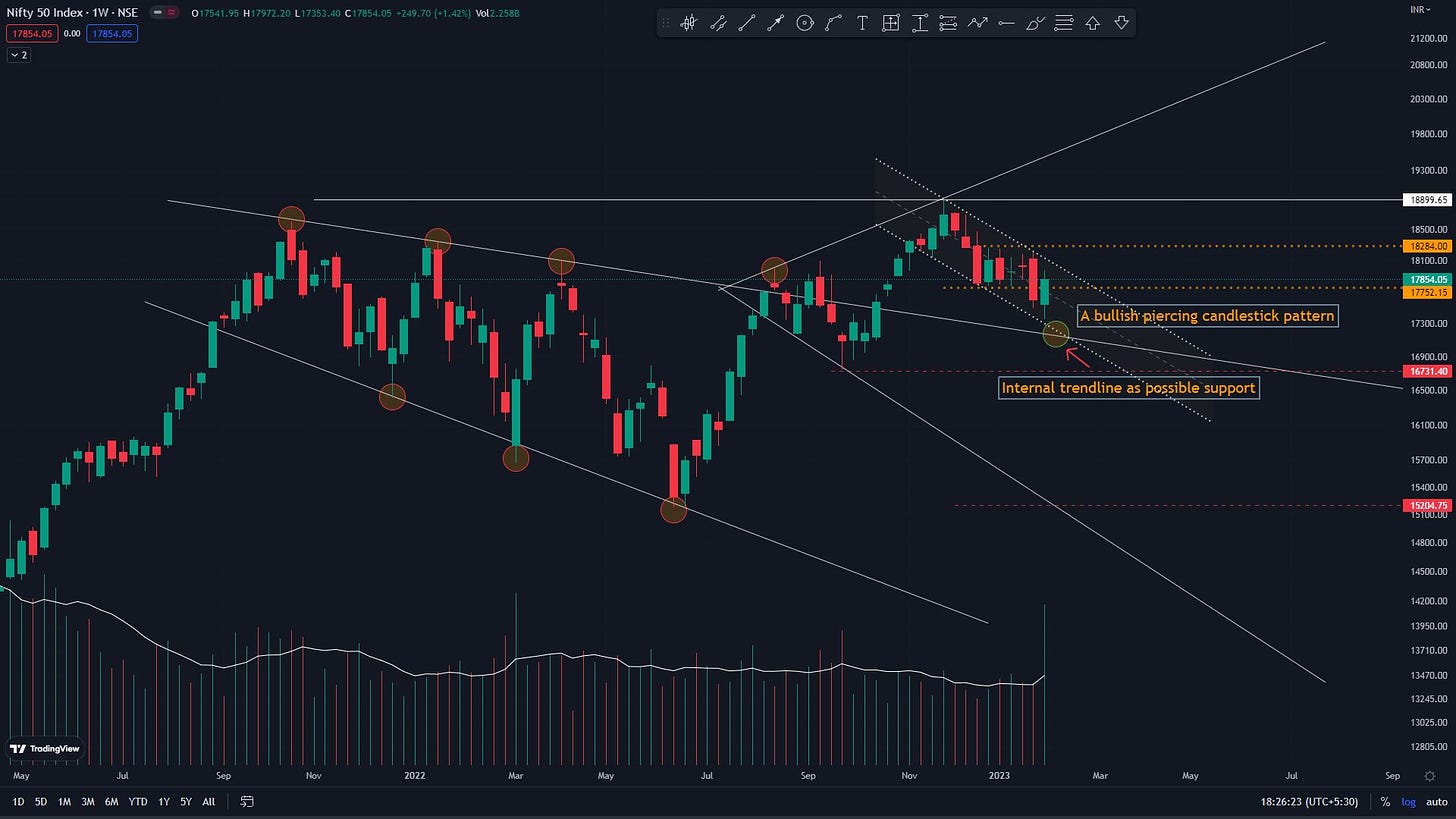
Nifty 50:
A bullish piercing candle this week, going back into the range it broke last week.
You can see a small descending channel, that needs to be broken on the up for any sort of bullishness.
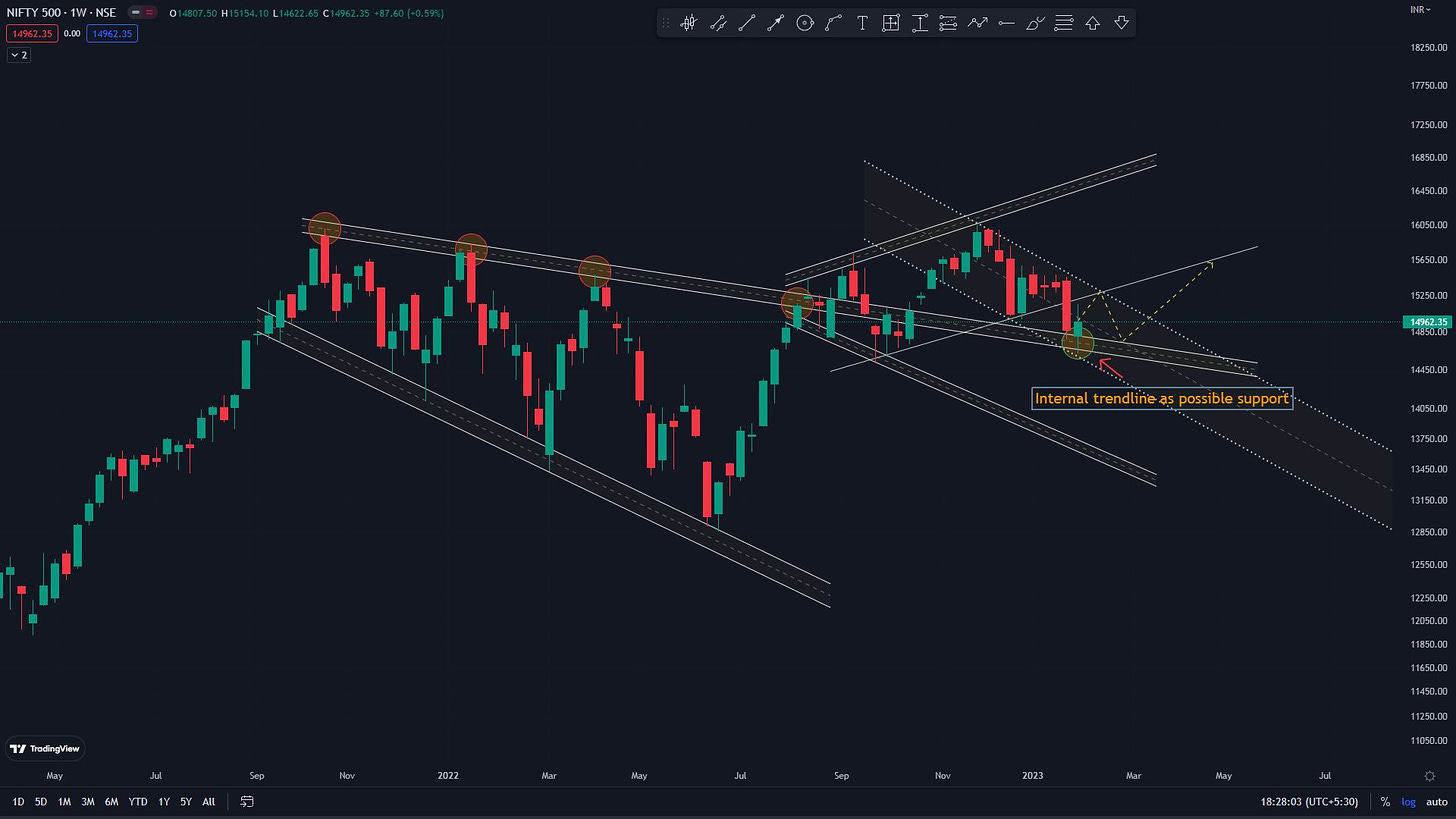
Nifty 500:
Similar to the Nifty 50, the Nifty 500 is inside a small descending channel.
We need to see a breakout out of this channel for any sustained uptrend.
Supported right now by the internal trendline.
That is all for this week.
Personally, January was a great month for me. I successfully sidestepped this fall (which I was backing myself to do after improving my breadth reading skills since the Dec 23rd fall last year).
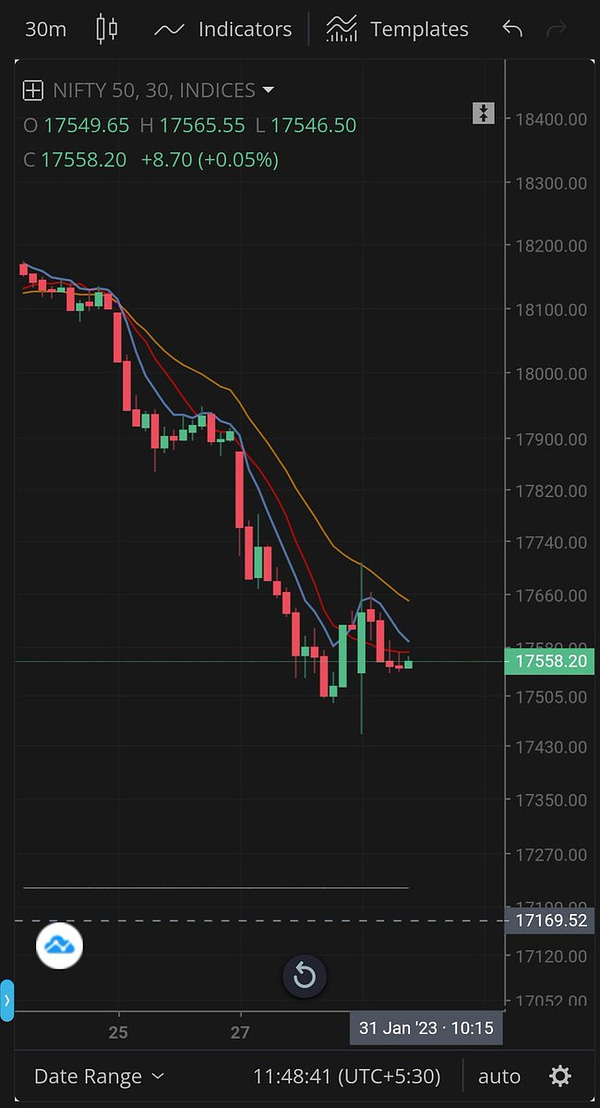
Last week as I declared that I would be backing myself to time the short-term bottom which I did try.
Here is my tweet where I anticipated a possible bottom in Nifty around 17558 levels.
So far working out well. Will try and time the top as well and/or add more at key levels as the market proves itself.
Not shying away and grinding out the process.
Follow me on twitter if you want to hear more than once a week from me.
See you next week.
& remember
always Risk First.


