

MATH: Momentum Anticipation and Trend by Homma:
MATH last week: Click the link
As technical traders, we
“Anticipate, but confirm. Wish, but only react.”
"Skate to where the puck is going to be, not where it has been." ~ Wayne Gretzky
By anticipate, I do not mean “make positions earlier”. What I mean is, assign probabilities to all possible scenarios of what could happen next. Stack those probabilities when those scenarios unfold. And change (increase/decrease) your risk exposure according to changing (increasing/decreasing) Market breadth.
And be mentally prepared with the(your) response. It is a mental exercise. It helps you act faster when the confirmation eventually comes in.
Lastly, be okay with any result/possibility that comes next.
Trend: Bearish & trending down.
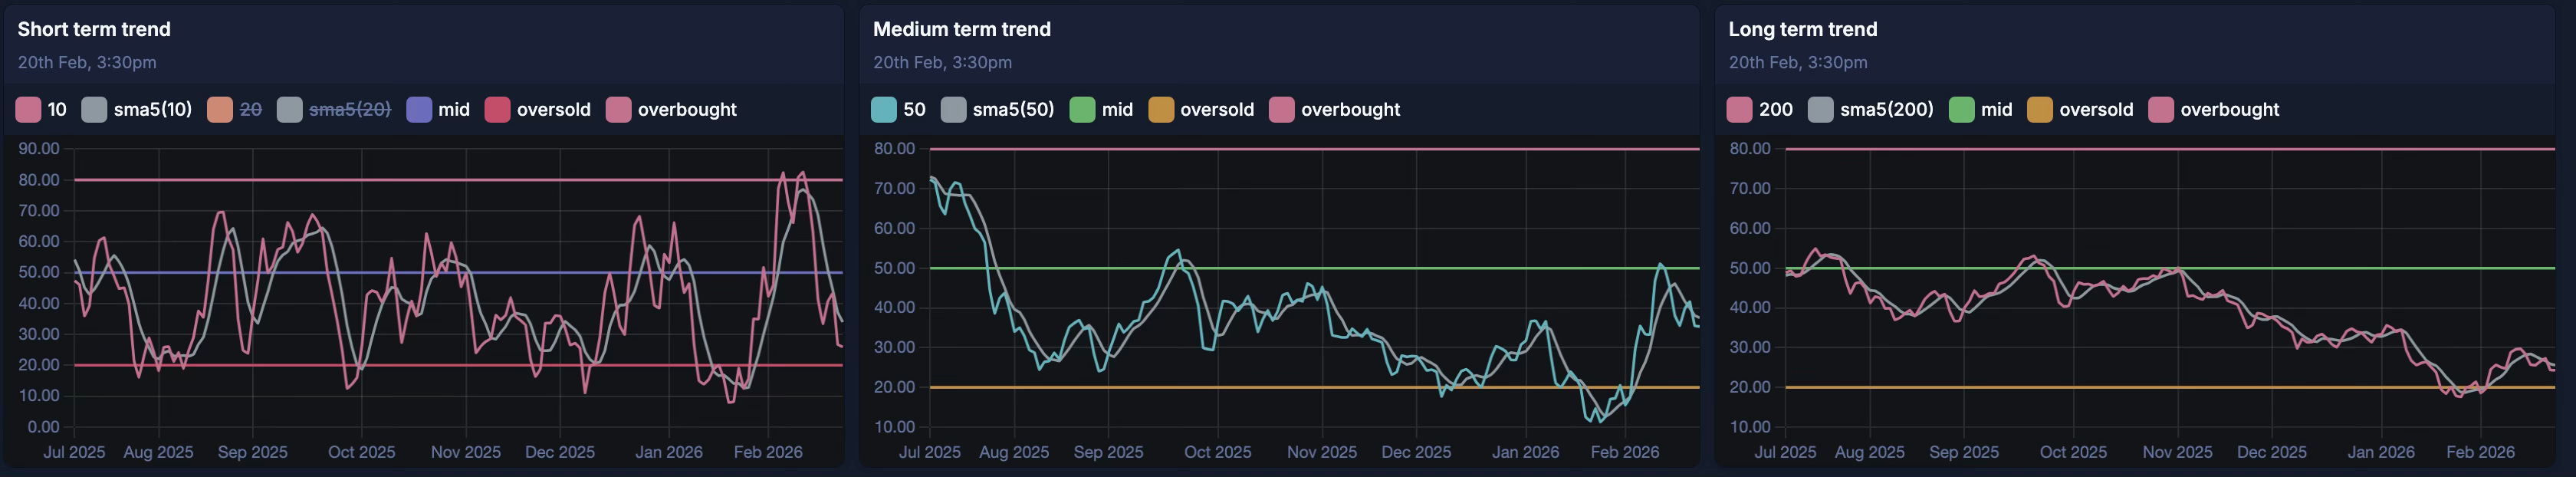
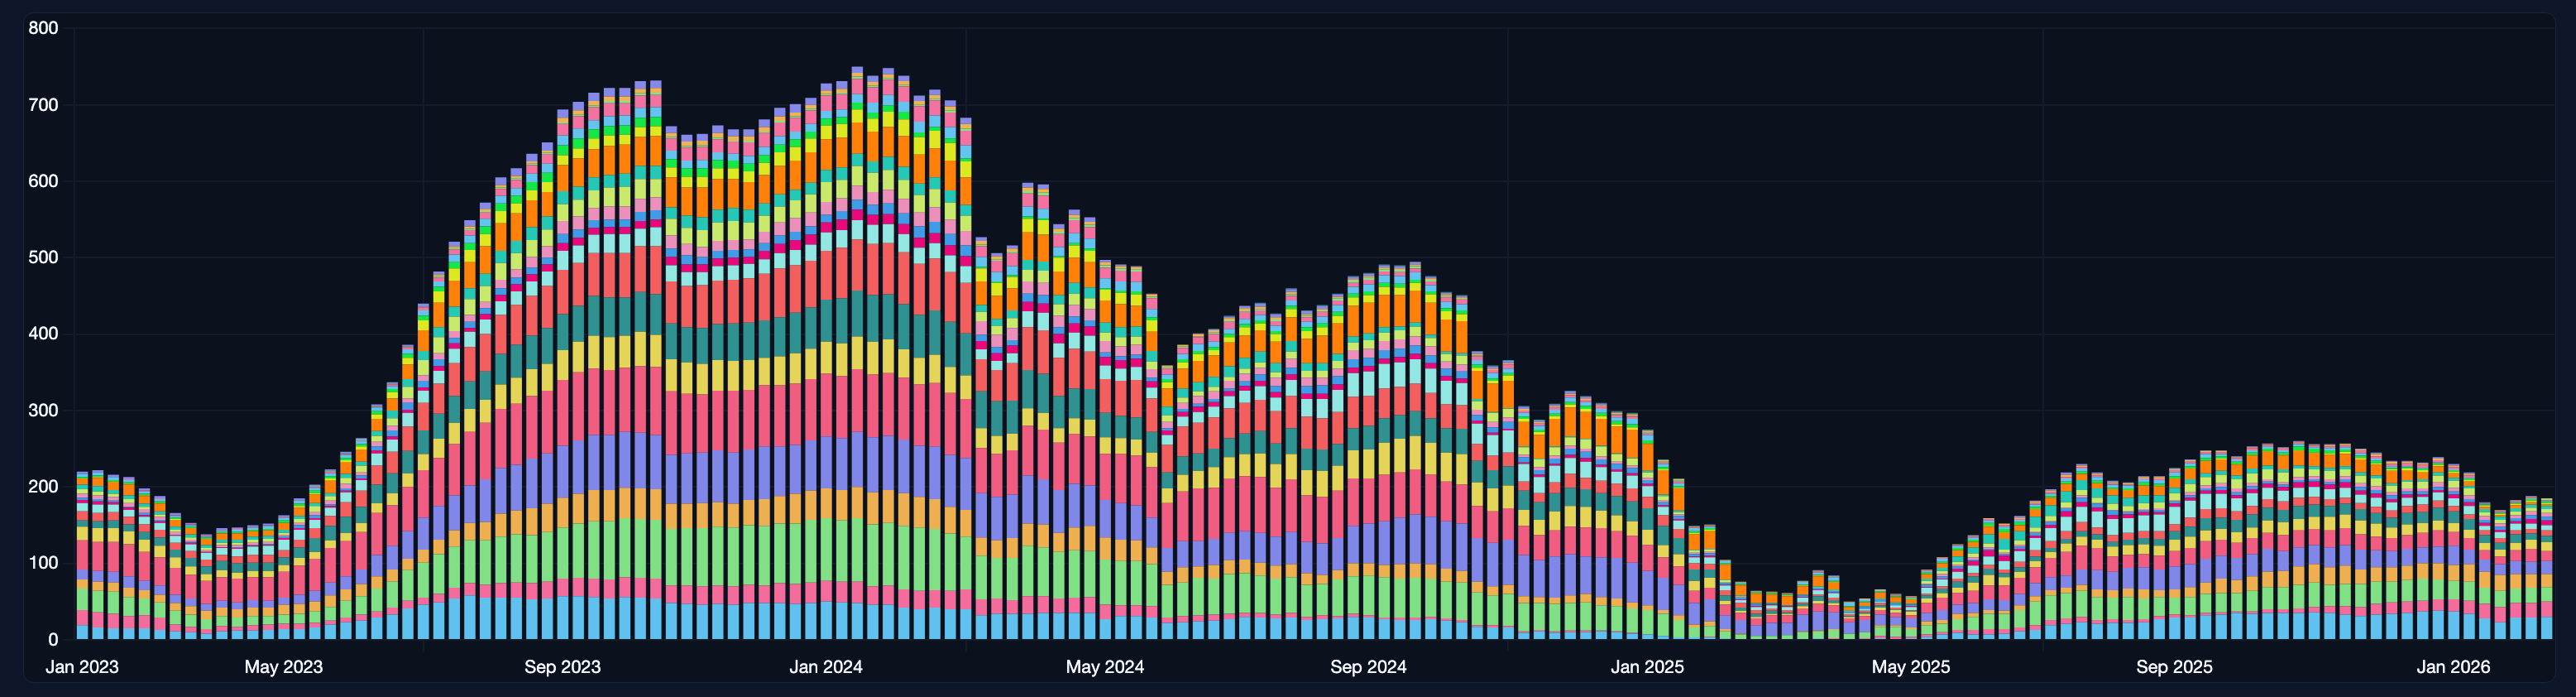
Short-term: “Percentage of stocks above 10/20-DMA”
Medium-term: “Percentage of stocks above 50-DMA”
Long-term: “Percentage of stocks above 200-DMA”
In the short term, bearish and trending down.
In the medium term, bearish and trending down.
In the long-term, bearish and trending down.
Momentum:
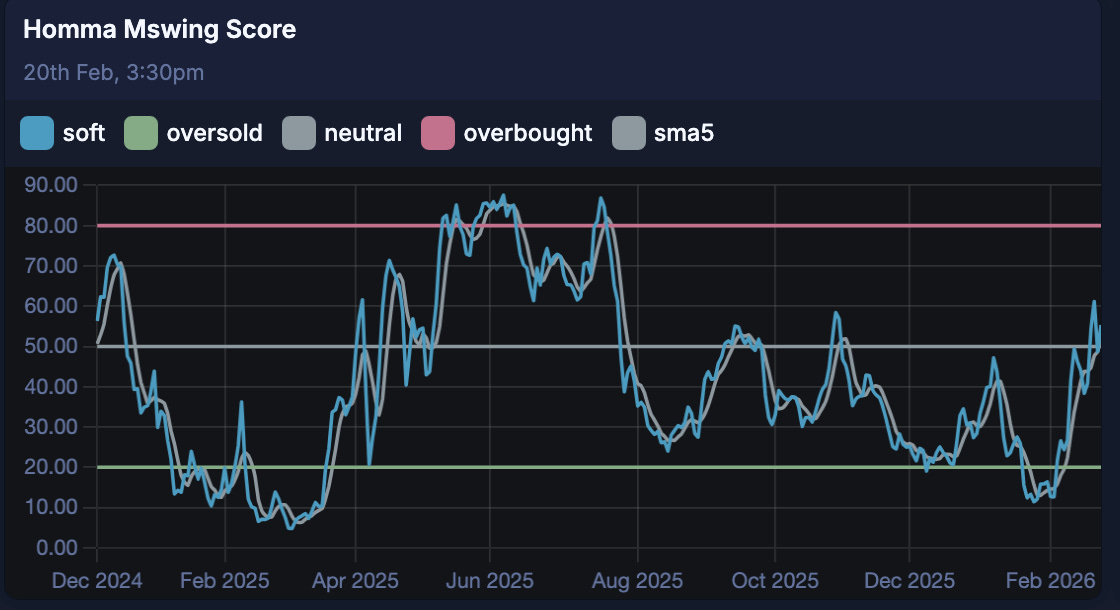
Homma Mswing Score: (basal Momentum)
Around the mid-line.
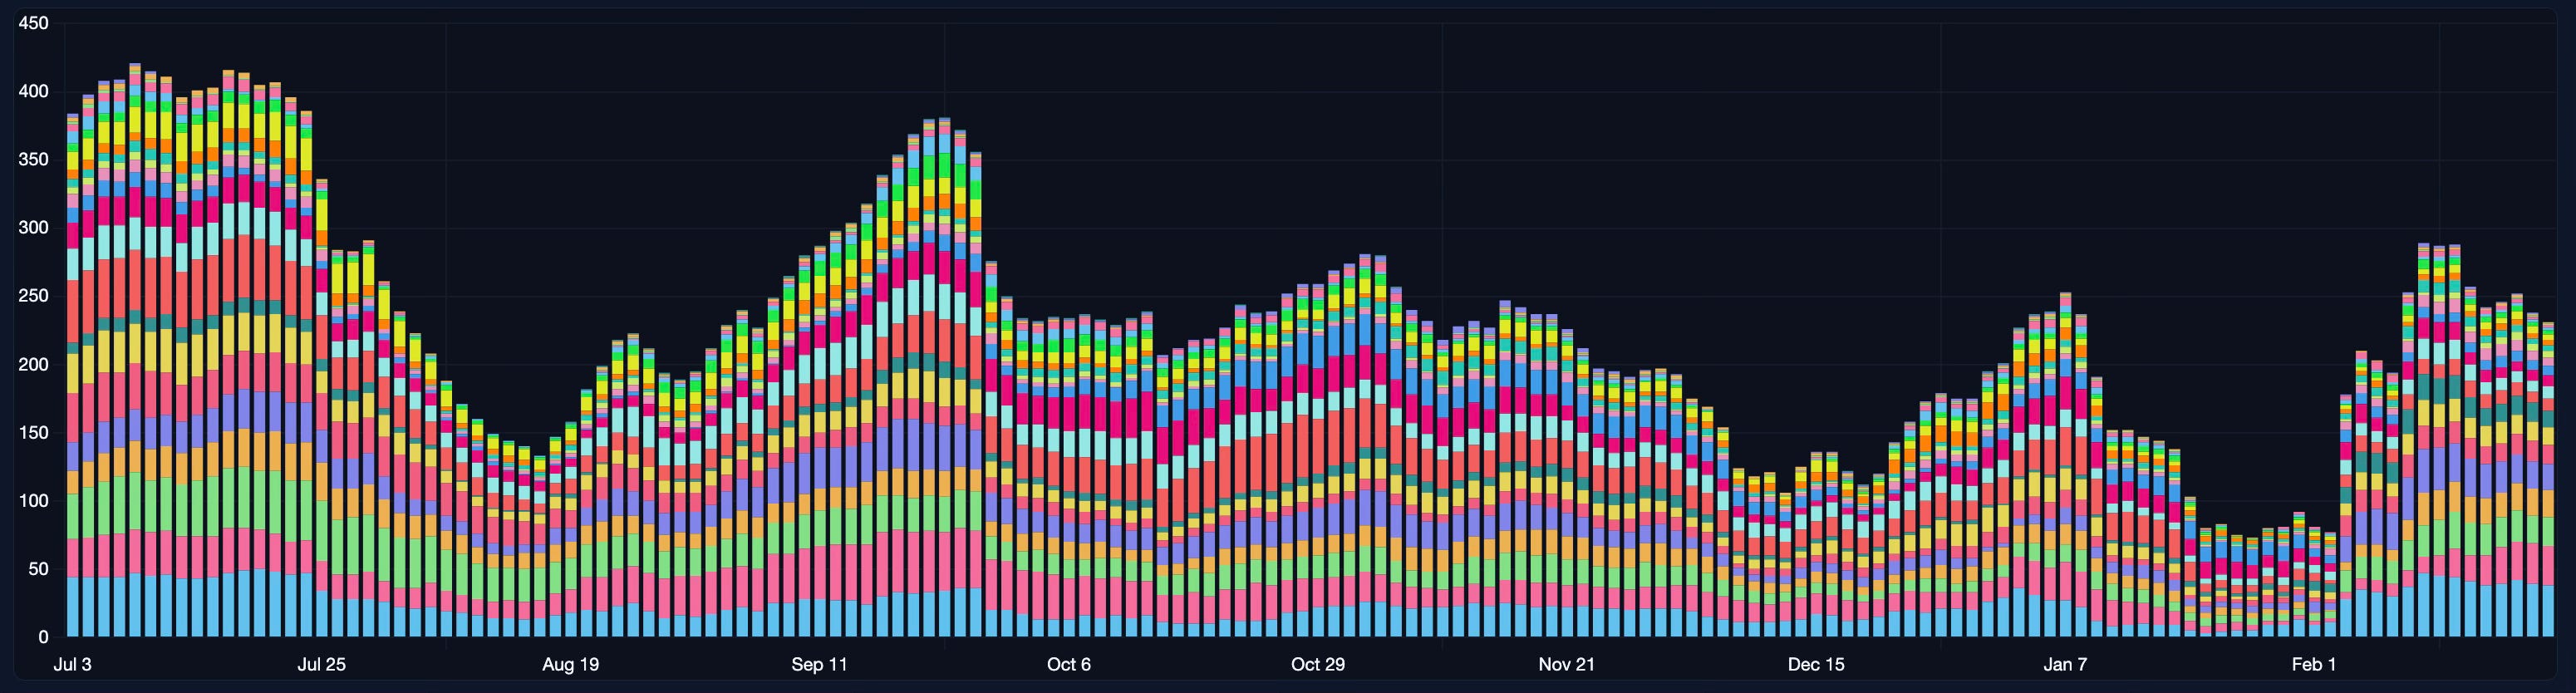
Landry Daily: (Hard Momentum. Momentum Bias for Swing Play)
(Landry Momentum plot is lagging in nature).
In a downswing.
Landry Weekly (Momentum Bias for Positional Play):
(Landry Momentum plot is lagging in nature).
Flat
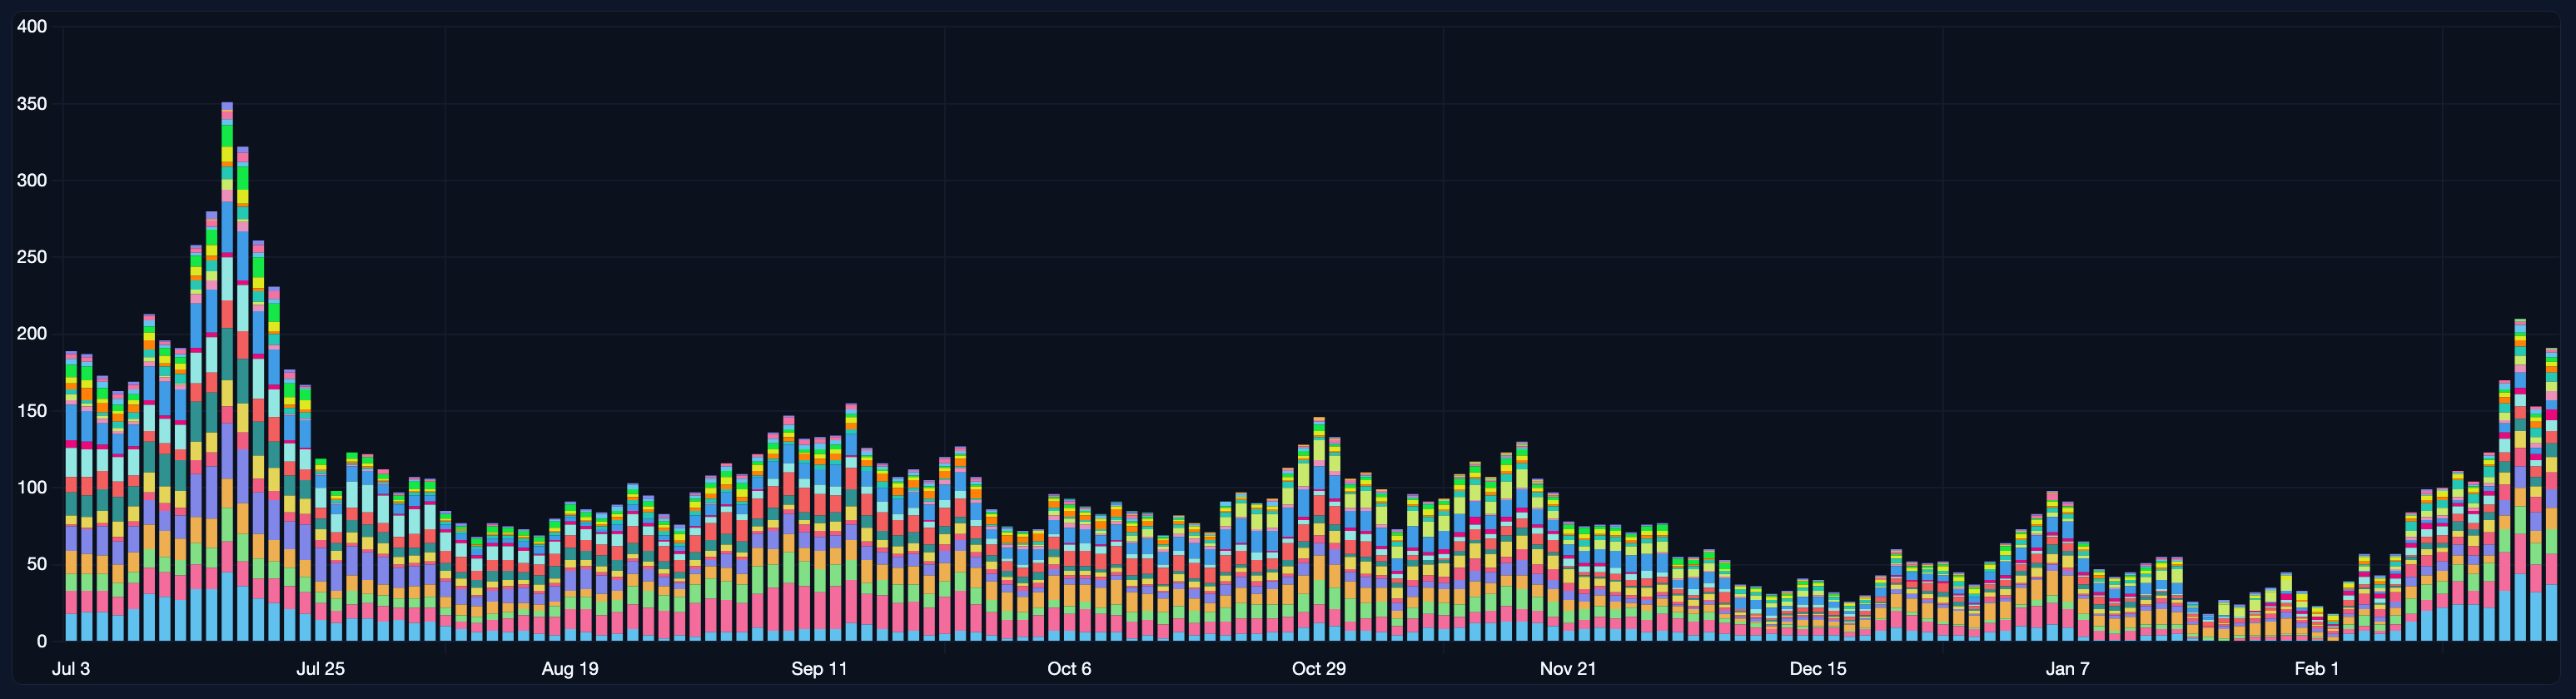
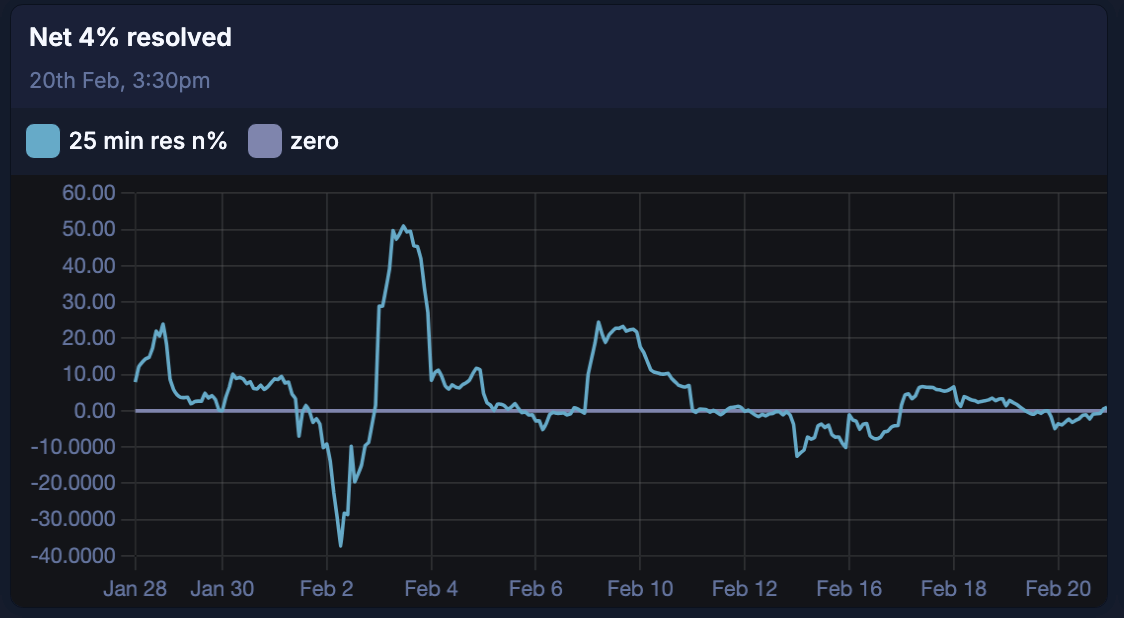
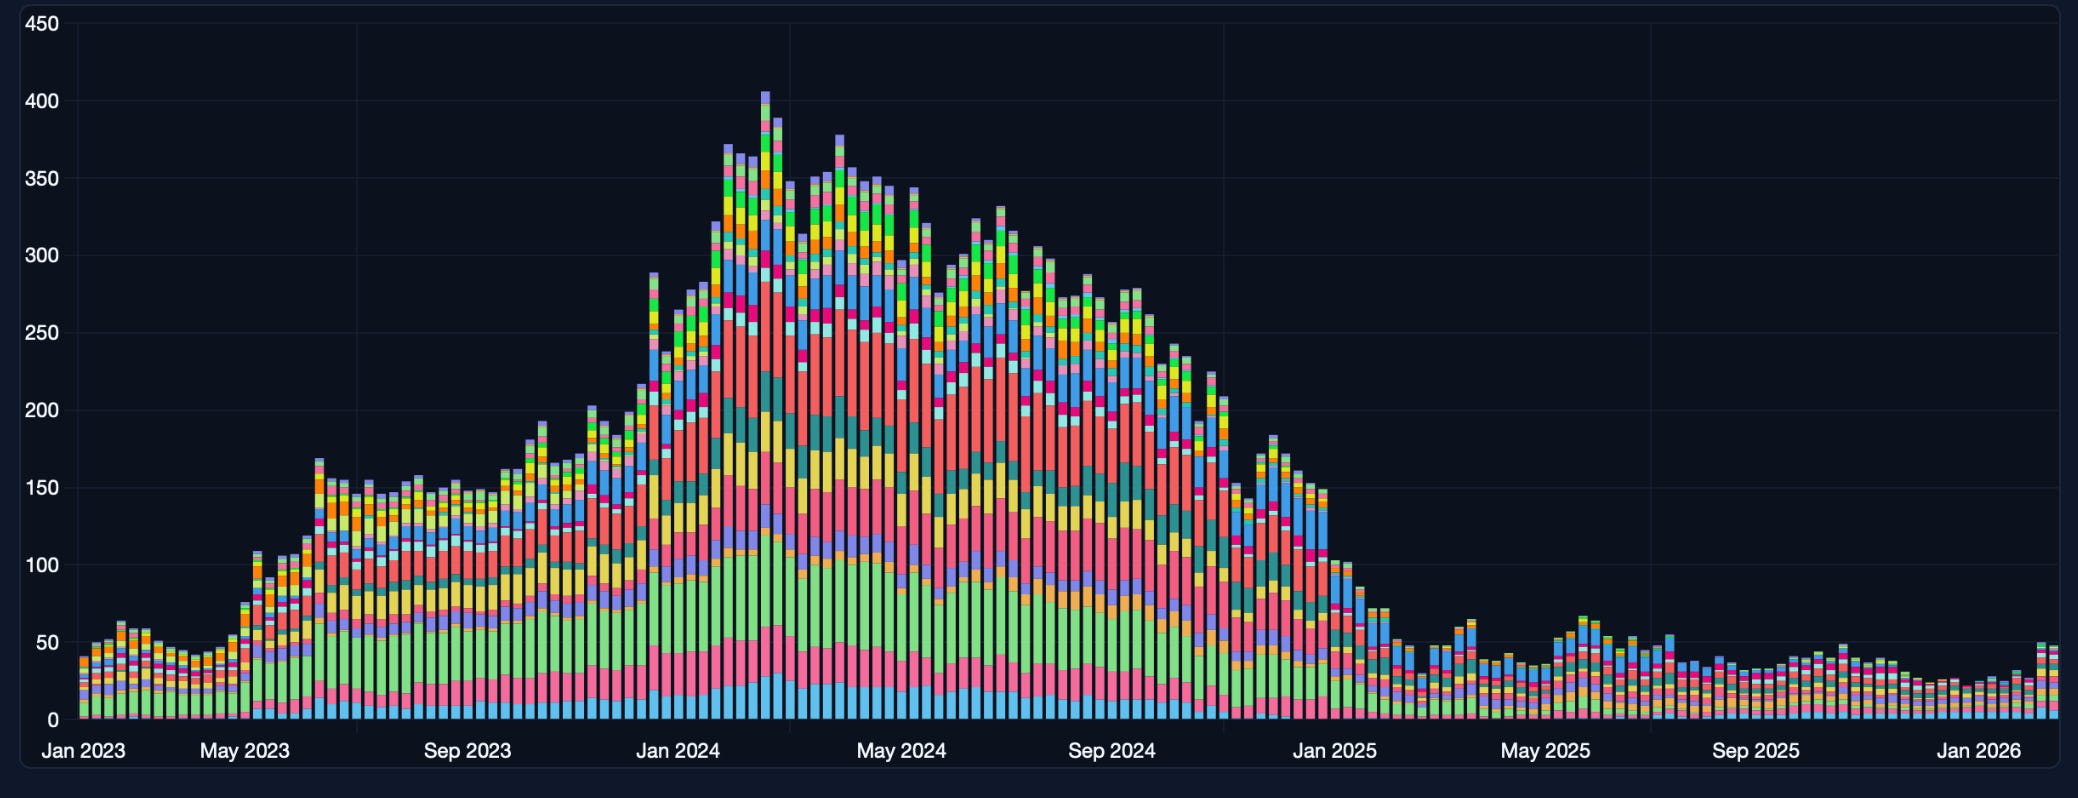
Net4% Movers: Bearish
Coiling around the 0 line.
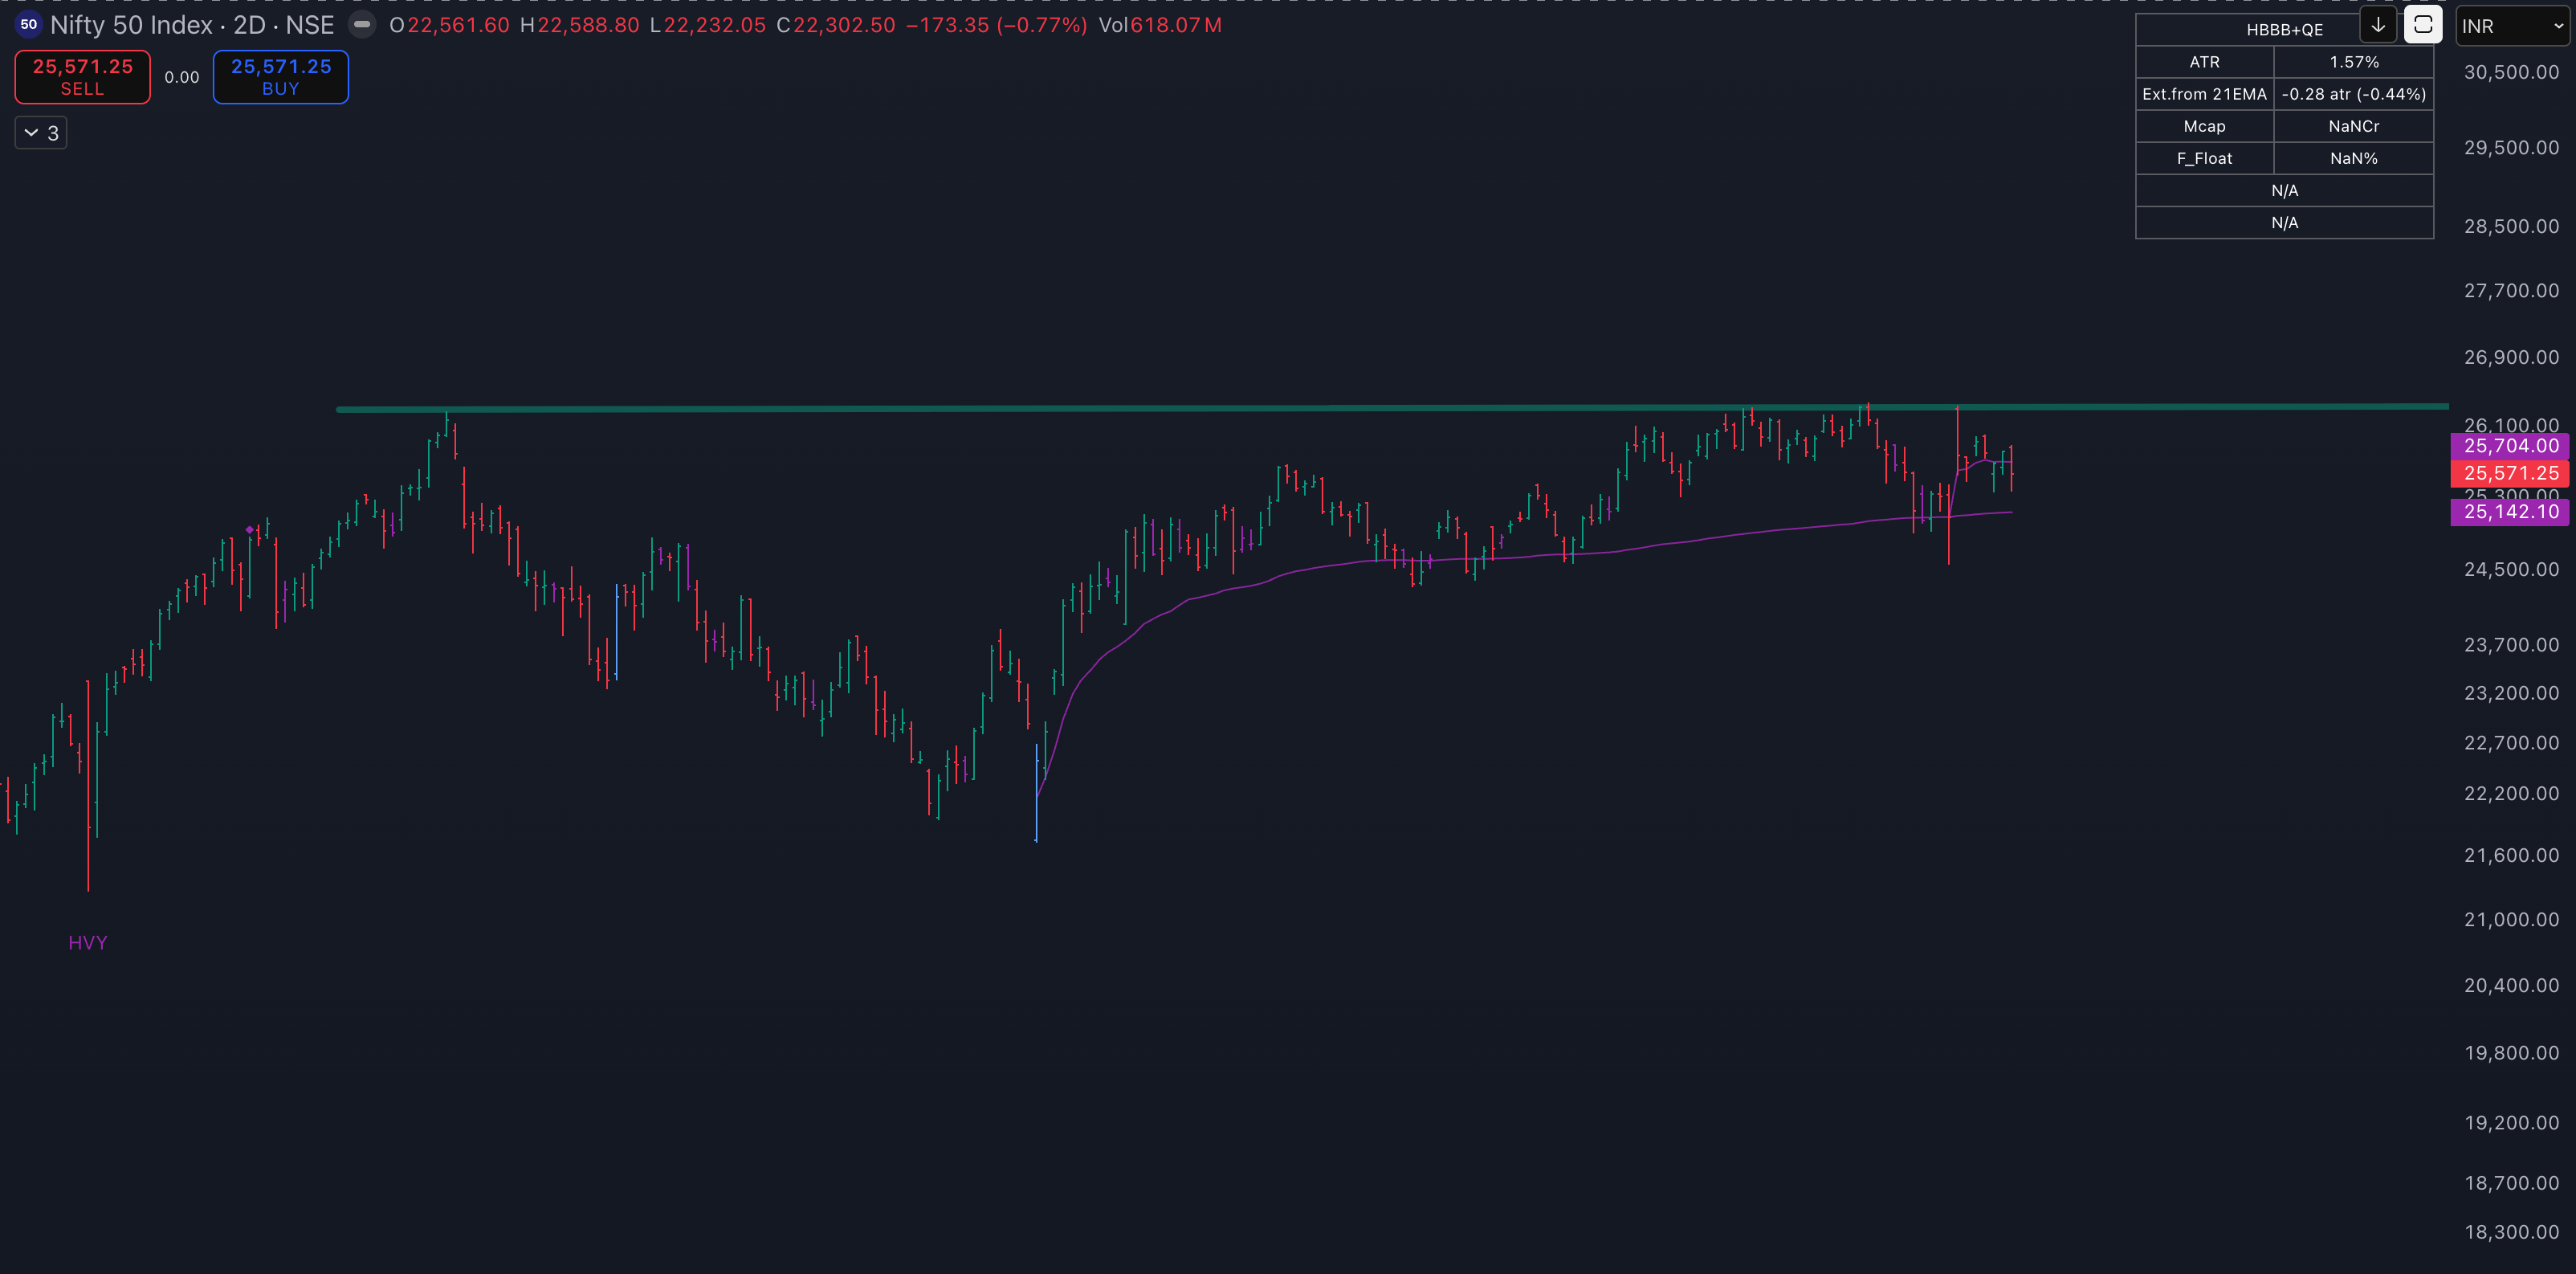
N50:
Nifty is sideways and volatile.
Still forming the right side of the base.
25100-24750 is a support zone.
A fair bias is that it can find support around and above these levels.
Be open to possibilities of a breakdown.
As always, we wait for confirmation of the upmove on the breakout of the bigger base for us to go to an Easy Money environment.
Anticipation:
Still building the right side of the base.
Volatile.
At the trendline support.
As such, there is an equal probability of a breakdown (& downtrend) vs a breakout (& an uptrend).
Easy money only on a confirmed breakout of the big base.
Positional bias = Still No money
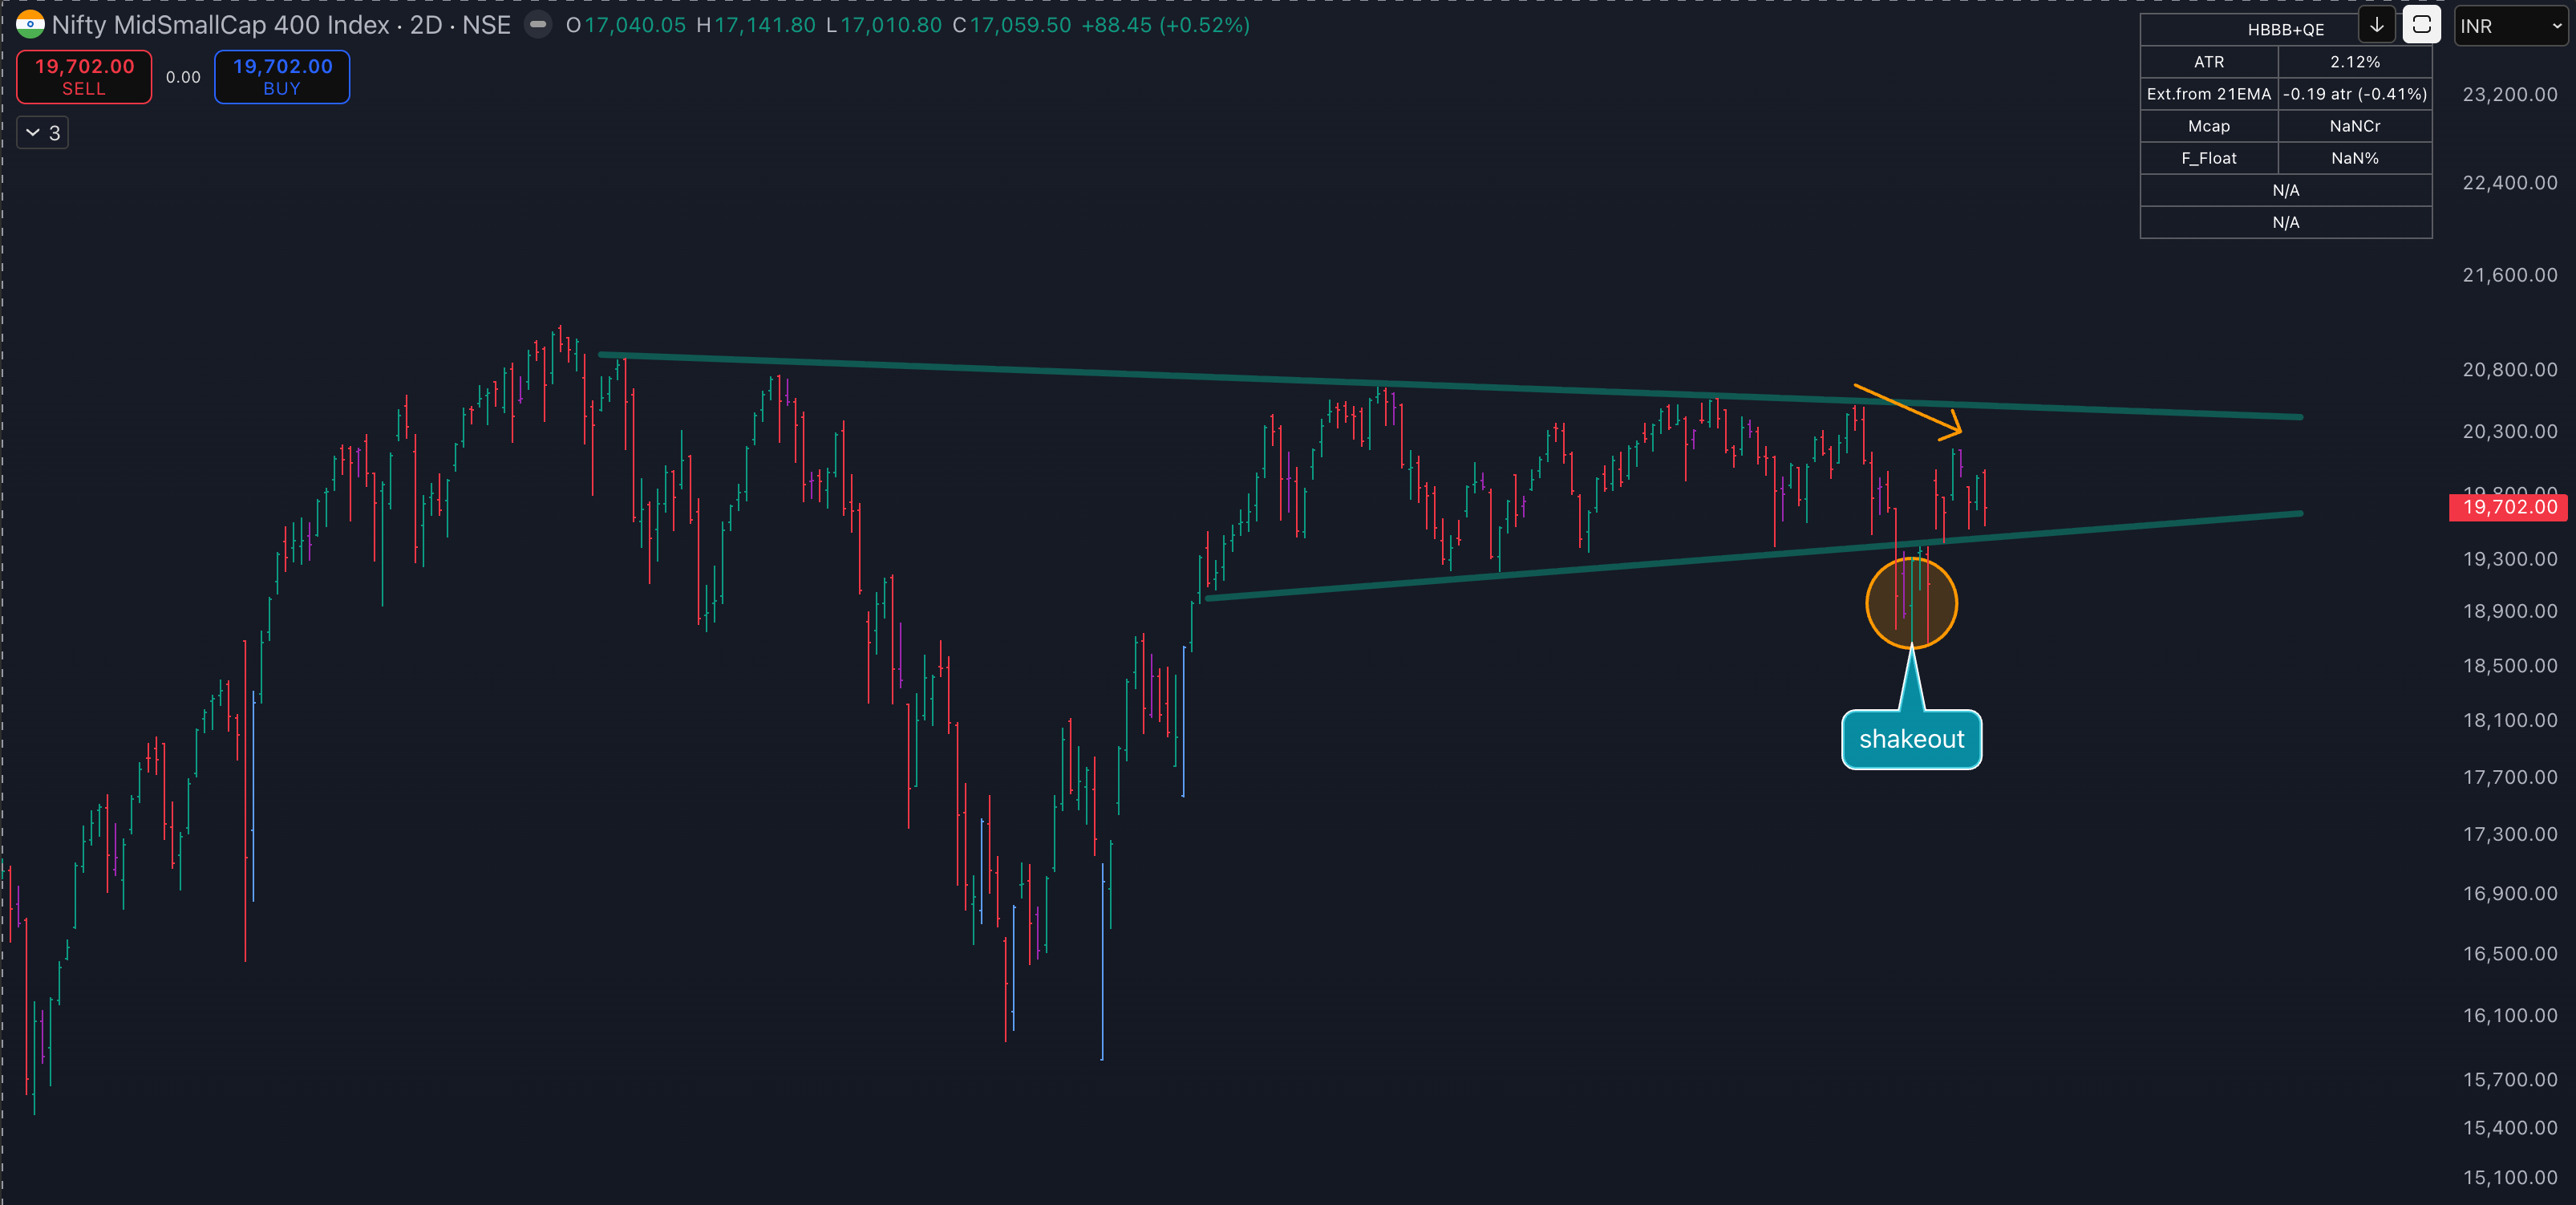
PS: Anticipations are often wrong, and biases should be adjusted after every candle.
If you dont know this already, I update my Market MATH every day on my website under the BREADTH section. Please check in every day post-market.
A quirky Bull Market indicator:
One that tells you for sure when a bull market is in.
One that eases your anxiety and assures you that the market will NOT take off without you.
One that keeps you from jumping in too big, too soon.
One that keeps your expectations in check, IF you are still trading.
(link to the indicator at the bottom)
Observation: 2 uptick. Need more
So is the Bull market in yet?
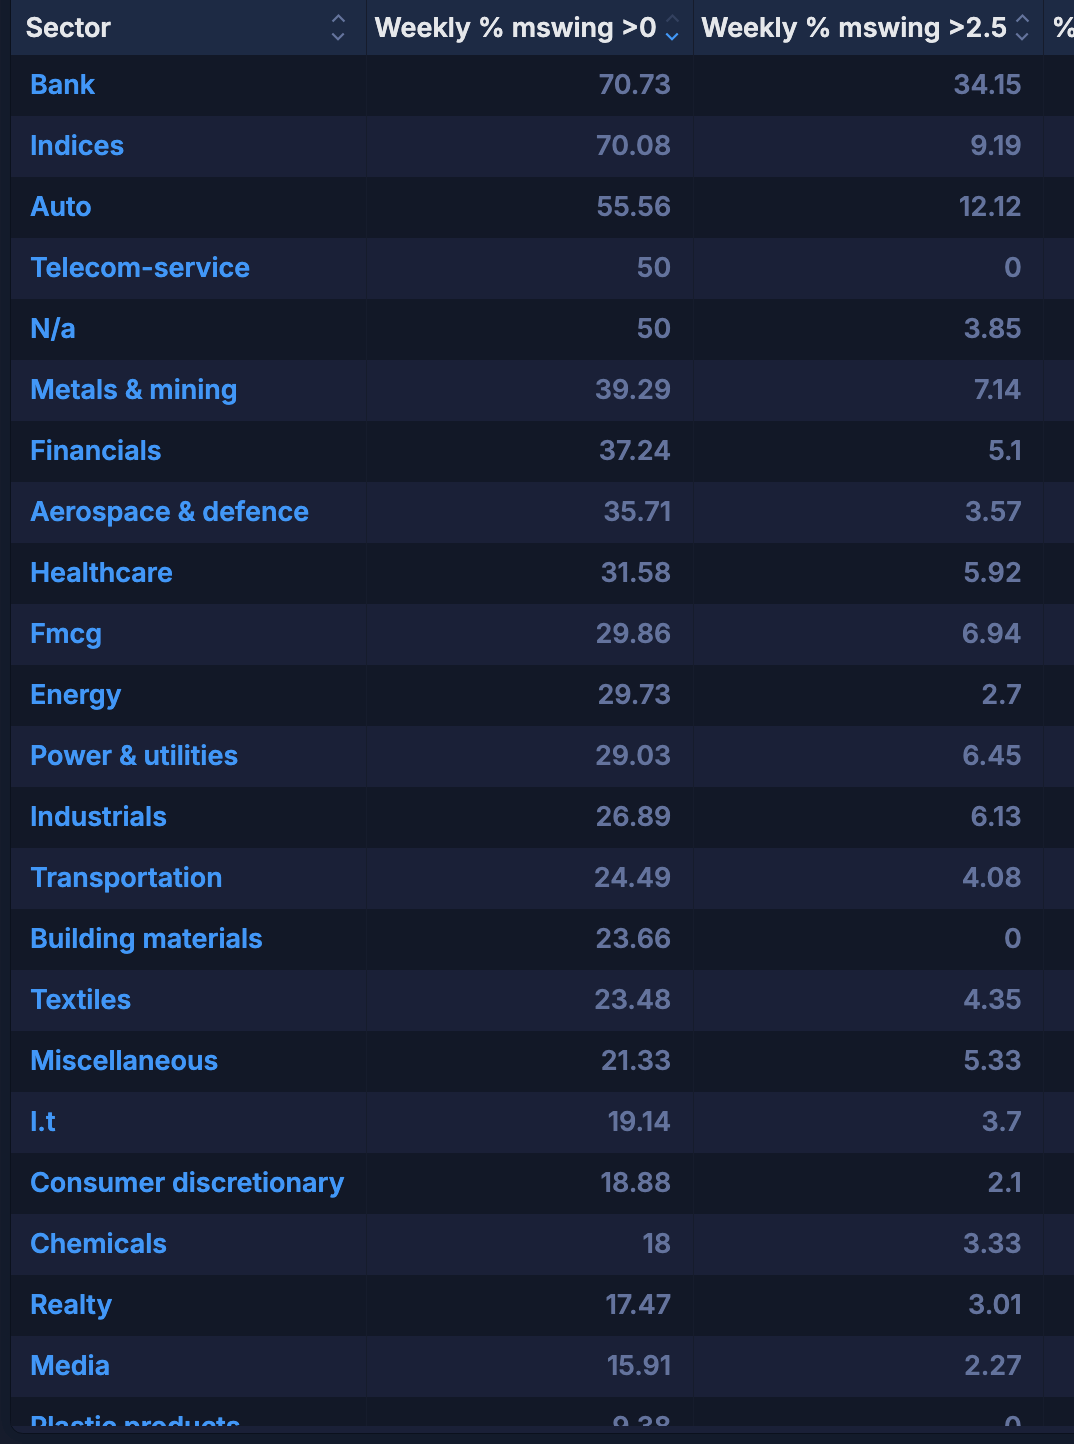
Group Strength:
Sectoral:
Leading groups: Banks, Autos, Metal-Como, Defence
Most Bullish this Week = PSU Banks.
Strength continuation =
Bottom Strength =
Sectors/Groups I like as LRE = Metals and commodities
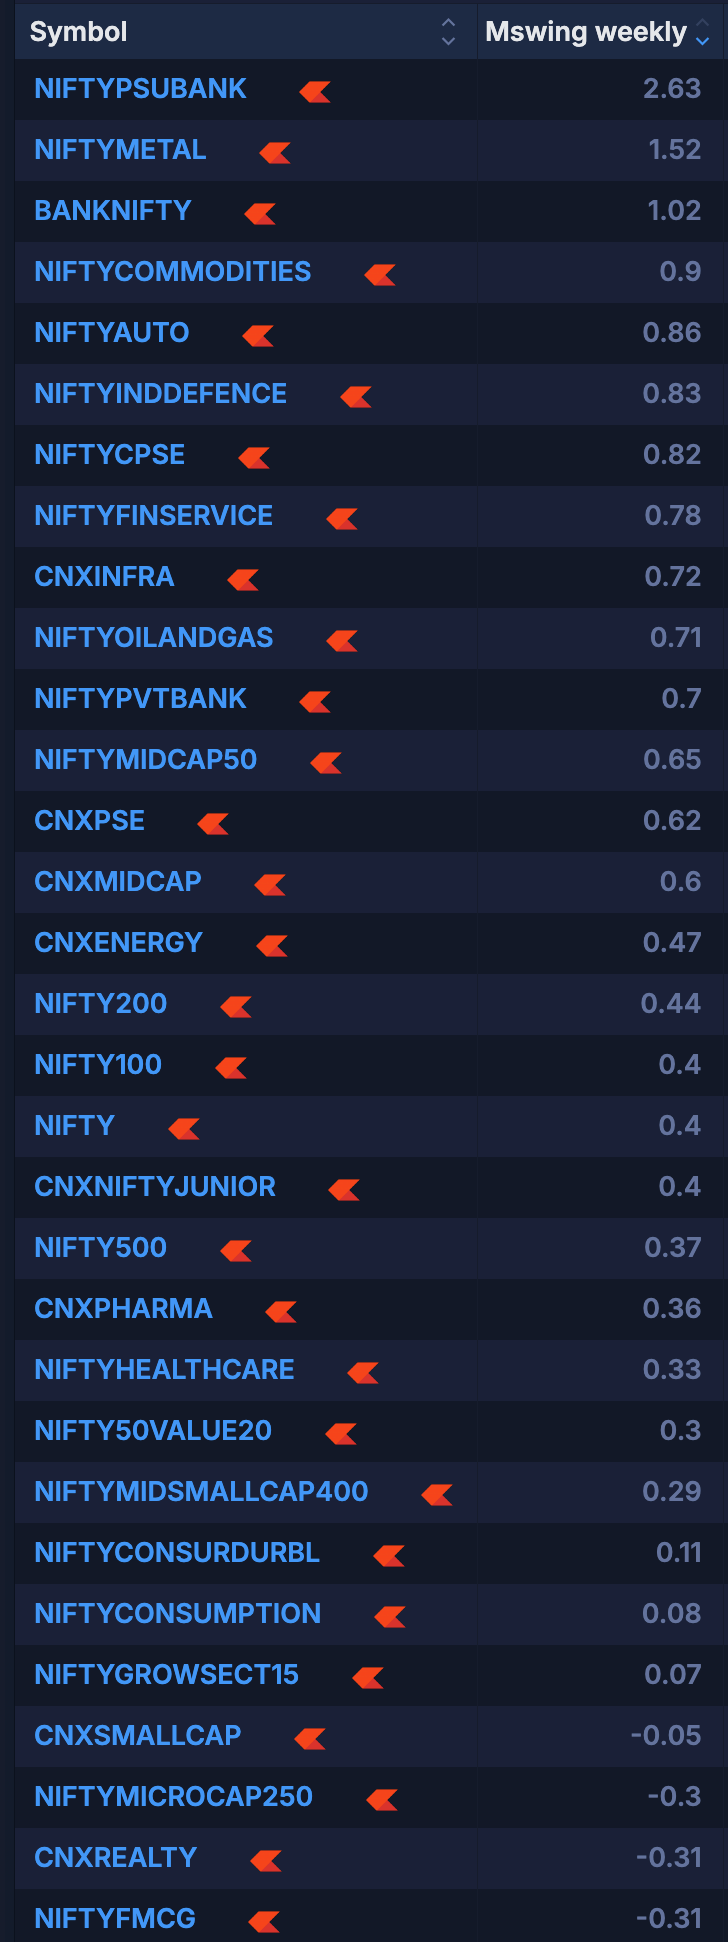
Index:
Leaders = PSU Banks, Metals and commodities, Defence, Auto
Most bullish this week = PSU Banks
Indices I like as LREs = Metals
Watchlists:
Follow the Strongest Stocks (the RS 100 and RS 100 Liquid watchlists below):
Find Tightness candidates from Tandem Inside bars and Triple Tight Star scan.
Earnings/Tradable Gaps are caught by the scanner TGP (tradable Gap Pivots).
Homma scanners: https://www.sakatashomma.com/scanners
Find the lowest risk entries from the leading strongest groups in my actionable watchlist for the week below:
