MATH: Momentum Anticipation and Trend by Homma:
MATH last week: Click the link
The most comprehensive article on Breadth and Anticipation:
As technical traders, We
“Anticipate, but confirm. Wish, but only react.”
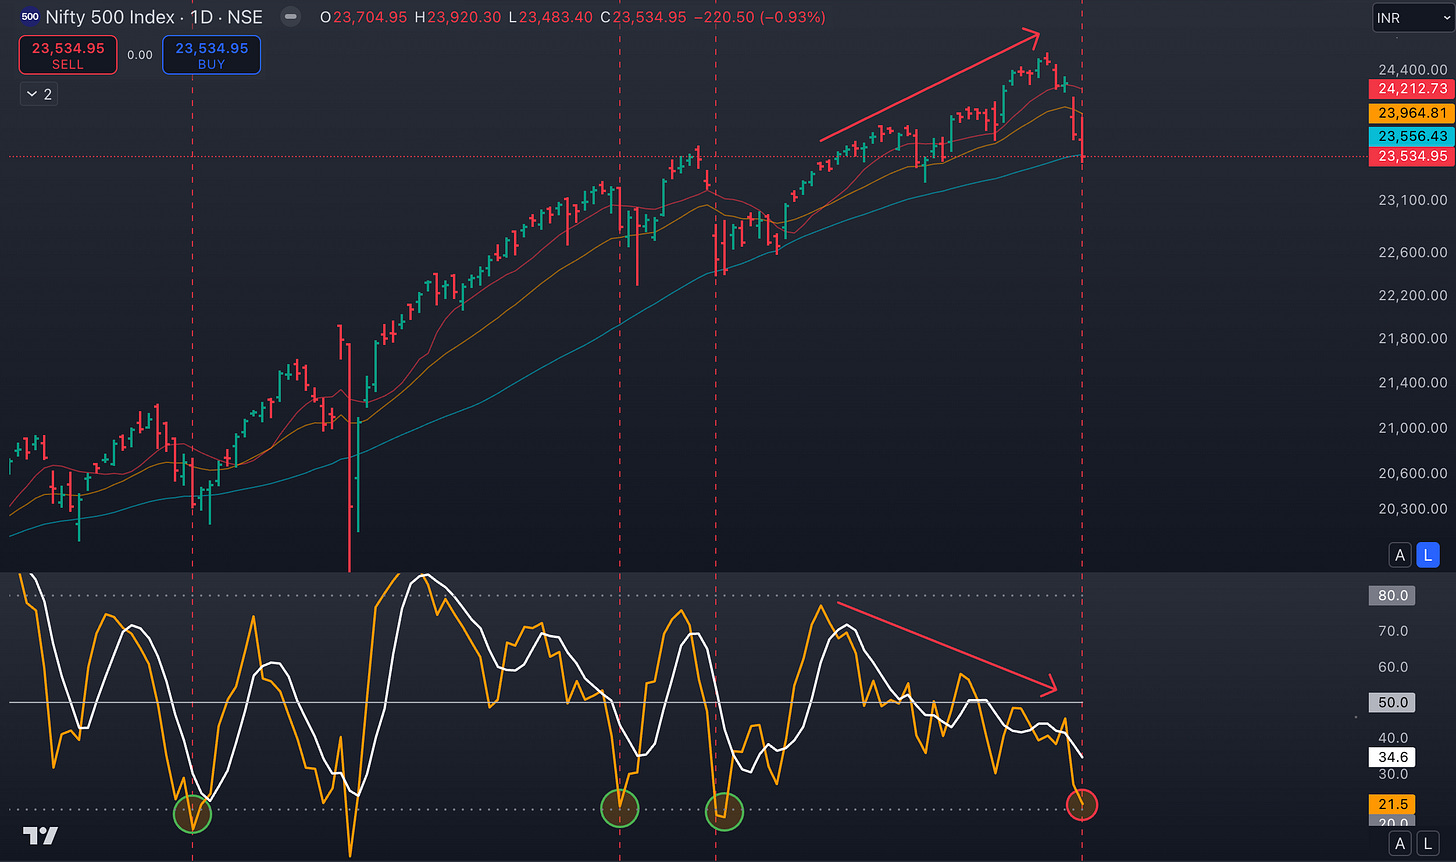
Trend: “Percentage of stocks above 10-DMA”
It is well below 50 which tells you about the bearish state of the market.
The bearish divergence with the Nifty500 was glaring.
Every time the index made a higher high, the breadth participation fell more.
But,
It is fast approaching the 20% level, considered oversold.
We have seen the index bounce every time it has reached that level previously.
This could mean a bounce around the corner (but we wait for confirmation)
Momentum: “10-day Rate of change”
This plot is still only hovering around the 0 mark.
Surprisingly.
This could mean it could get worse from here on (SL folks, SL).
N500 (same for N50):
Makes a Lower Low.
Now rests at the key 50-Day SMA.
This MA has been very supportive of the price on previous corrections.
Although the price candle doesn’t show any demand (lower wick candle) as yet.
On occasions, when the price has breached the MA, all of them turned out to be undercuts (aka shakeouts).
So, we hope (but confirm).
Net4% Movers:
2 back to back negative days on the print.
A closer look will tell you, that Friday was not as bearish as Thursday.
(It however doesn’t tell that Monday will not be bearish again).
If we are to see a bounce, the plot has to print a positive number.
Anticipation:
Nothing right now tells me that the bounce will come yet.
A few things in favor of a bounce are:
a) 50 DMA support
b) Oversold short-term breadth levels.
But we know that, 50DMA undercuts can happen and that oversold can remain oversold for some more time.
Hence, to anticipate a bounce very soon would be wishful thinking at best.
But I would not bet against it too.
If and when that comes, I will be looking for the following signs to confirm:
The shakeout scanner will spike (this is the earliest of signs)
The Net 4% data has to turn positive.
The breadth plot will cross above its 5-DMA.
The trend templates (Minervini-Landry etc) will start having a higher number of stocks trending Up.
And if we pull back deeper, trust your stops to take you into cash if you are not already.
I will refrain from opening any swing positions before I see a confirmation of the bounce.
Even if the bounce comes, it would be wise to keep open the possibility of a lower high and a long-term Top (I don’t want you all to forget that there is a Stage 3 and Stage 4 in the market cycle).
Group Strength:
The strongest groups last week:
Index:
Nifty Metals,
Pharma and Healthcare.
and IT among the high RS groups were resilient.
Nifty PSU Banks, a lagging group untill last week, was also resilient during this week’s fall.
Watchlists:
Keep reading with a 7-day free trial
Subscribe to The Technical Take to keep reading this post and get 7 days of free access to the full post archives.


