


Market MATH & Watchlist: 26-April-2025
Hard to NO Money| Bias: Key MAs to support

MATH: Momentum Anticipation and Trend by Homma:
MATH last week: Click the link
The most comprehensive article on Breadth and Anticipation:

As technical traders, we
“Anticipate, but confirm. Wish, but only react.”
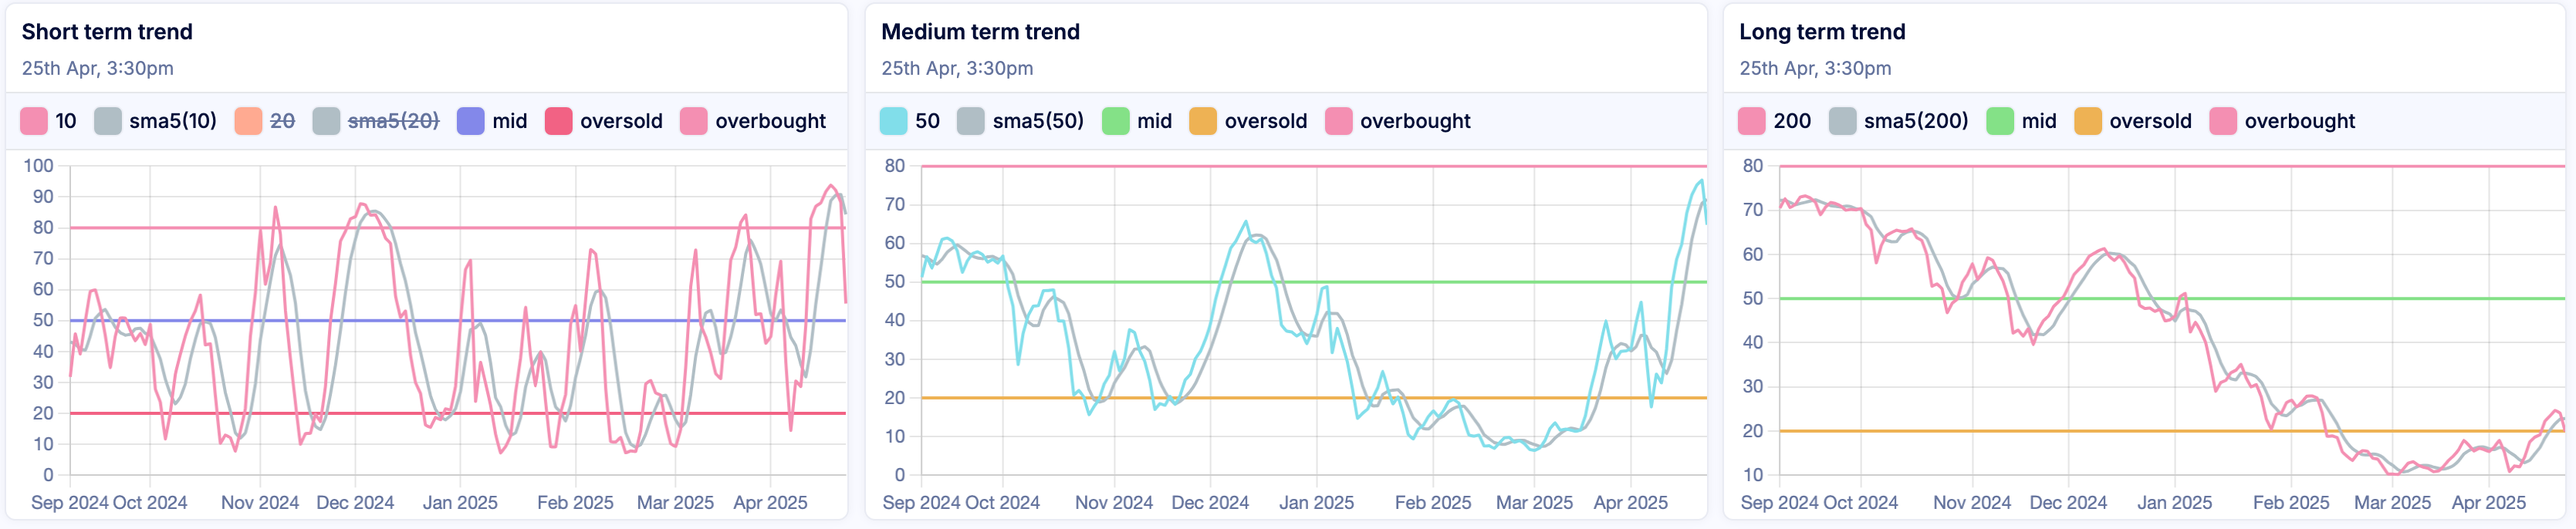
Trend:
Short-term: “Percentage of stocks above 10/20-DMA”
Medium-term: “Percentage of stocks above 50-DMA”
Long-term: “Percentage of stocks above 200-DMA”
In the short term, we reversed from the overbought zone.
In the medium term, we reversed from around the overbought zone.
Long-term, also we start trending down after spending sometime above the oversold zone.
Momentum:
Homma Mswing Score: (basal Momentum)
The momentum started decreasing ahead of the market pullback. 5th day of decreasing momentum.
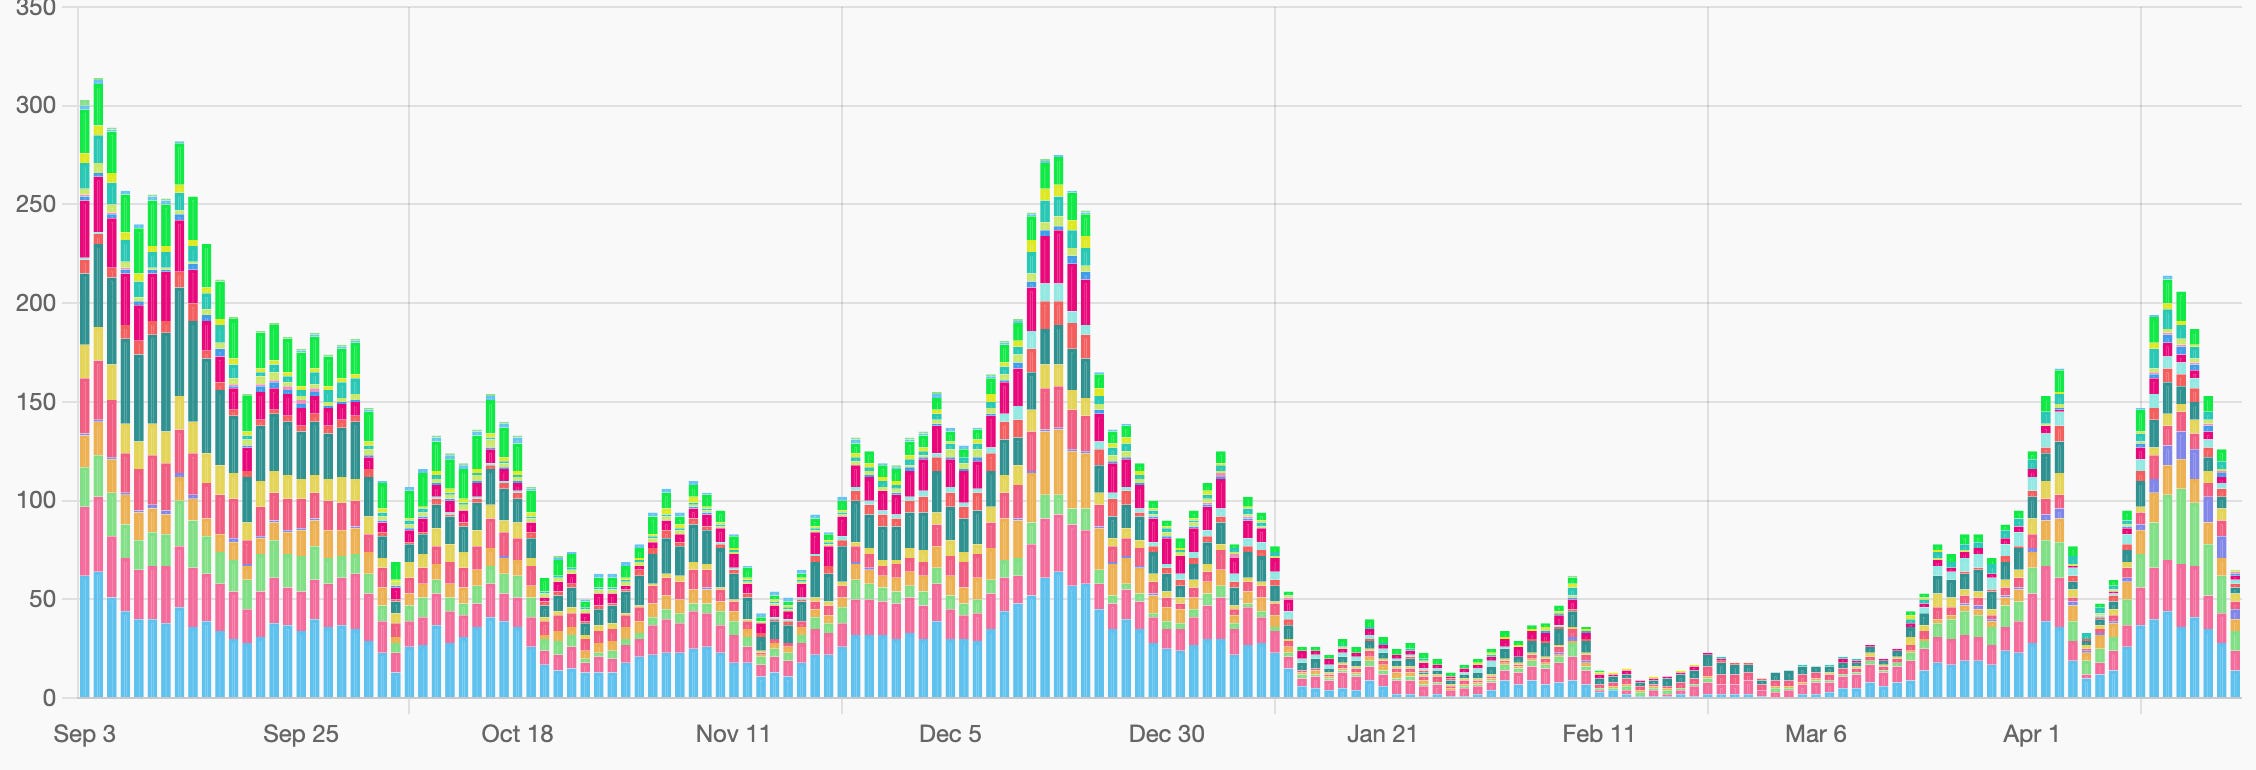
Landry Daily: (Momentum Bias for Swing Play)
Strong momentum (Momentum for swing trading) is still making Lower highs.

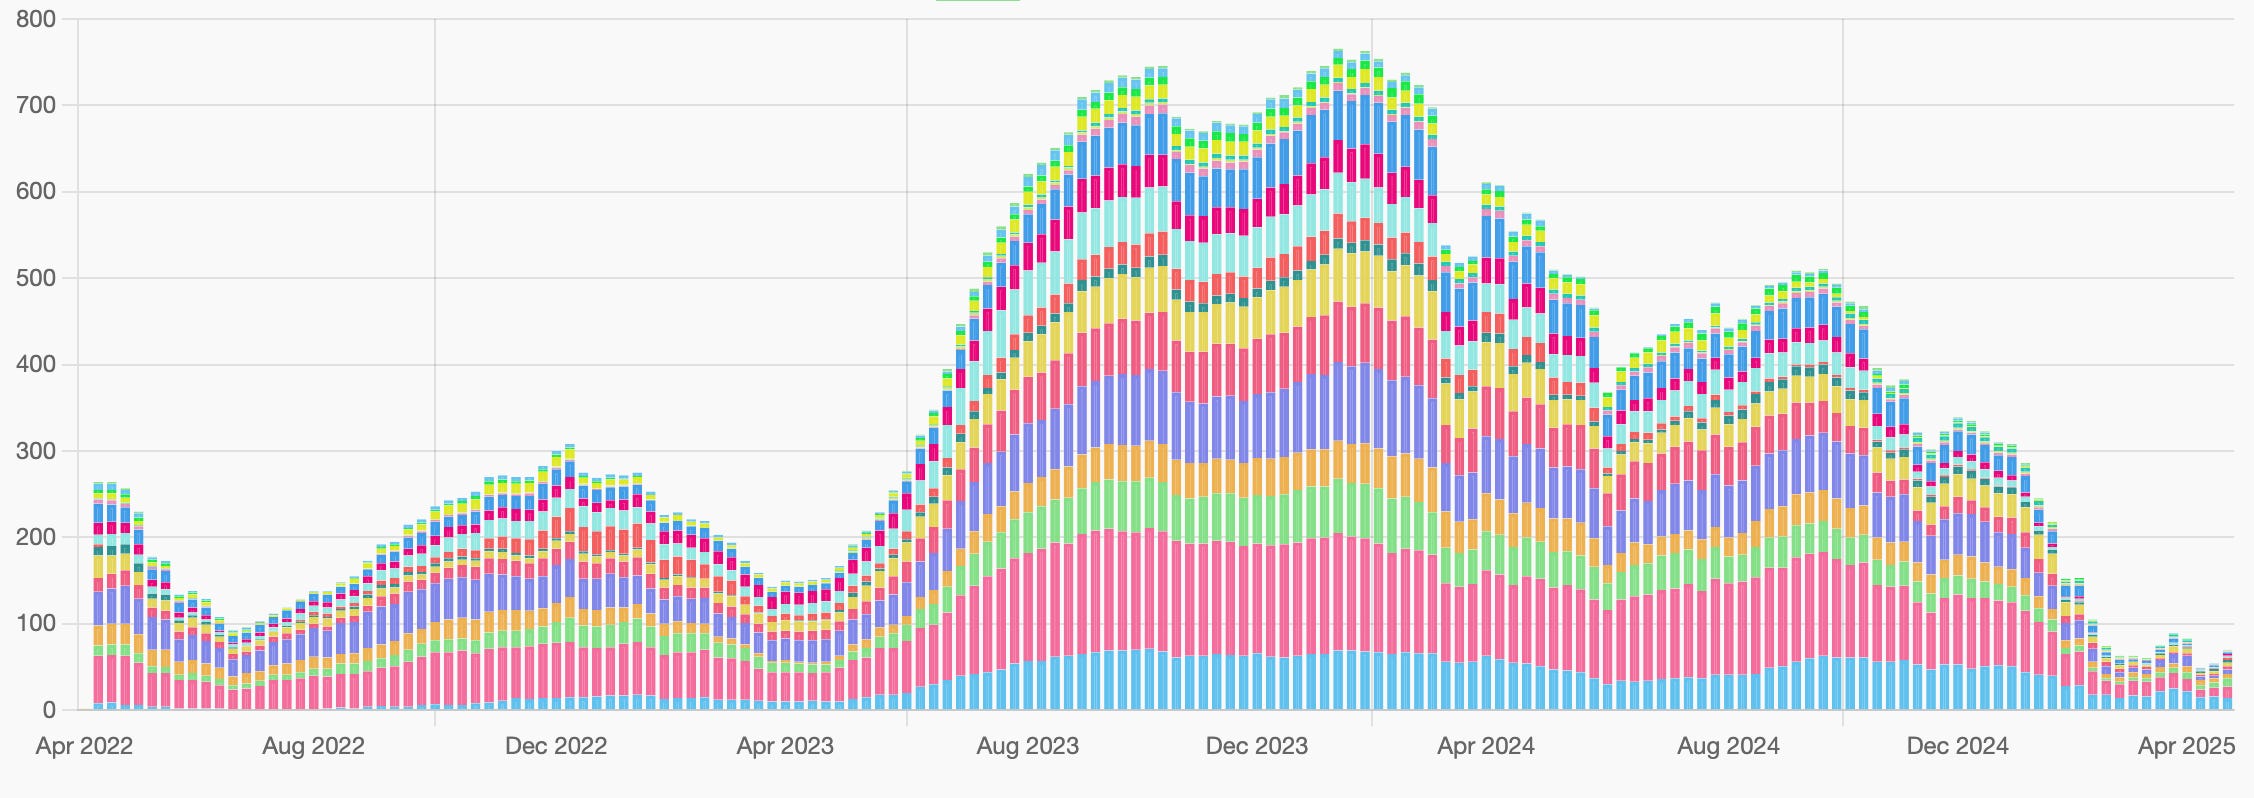
Landry Weekly (Momentum Bias for Positional Play):
Weekly momentum continues to languish at the bottom. Still making Lower Highs.
Therefore, shows that there is no reason to FOMO yet.
Net4% Movers:
Bullishness had been decreasing since the week opened. It finally went to negative territory on the week's close.

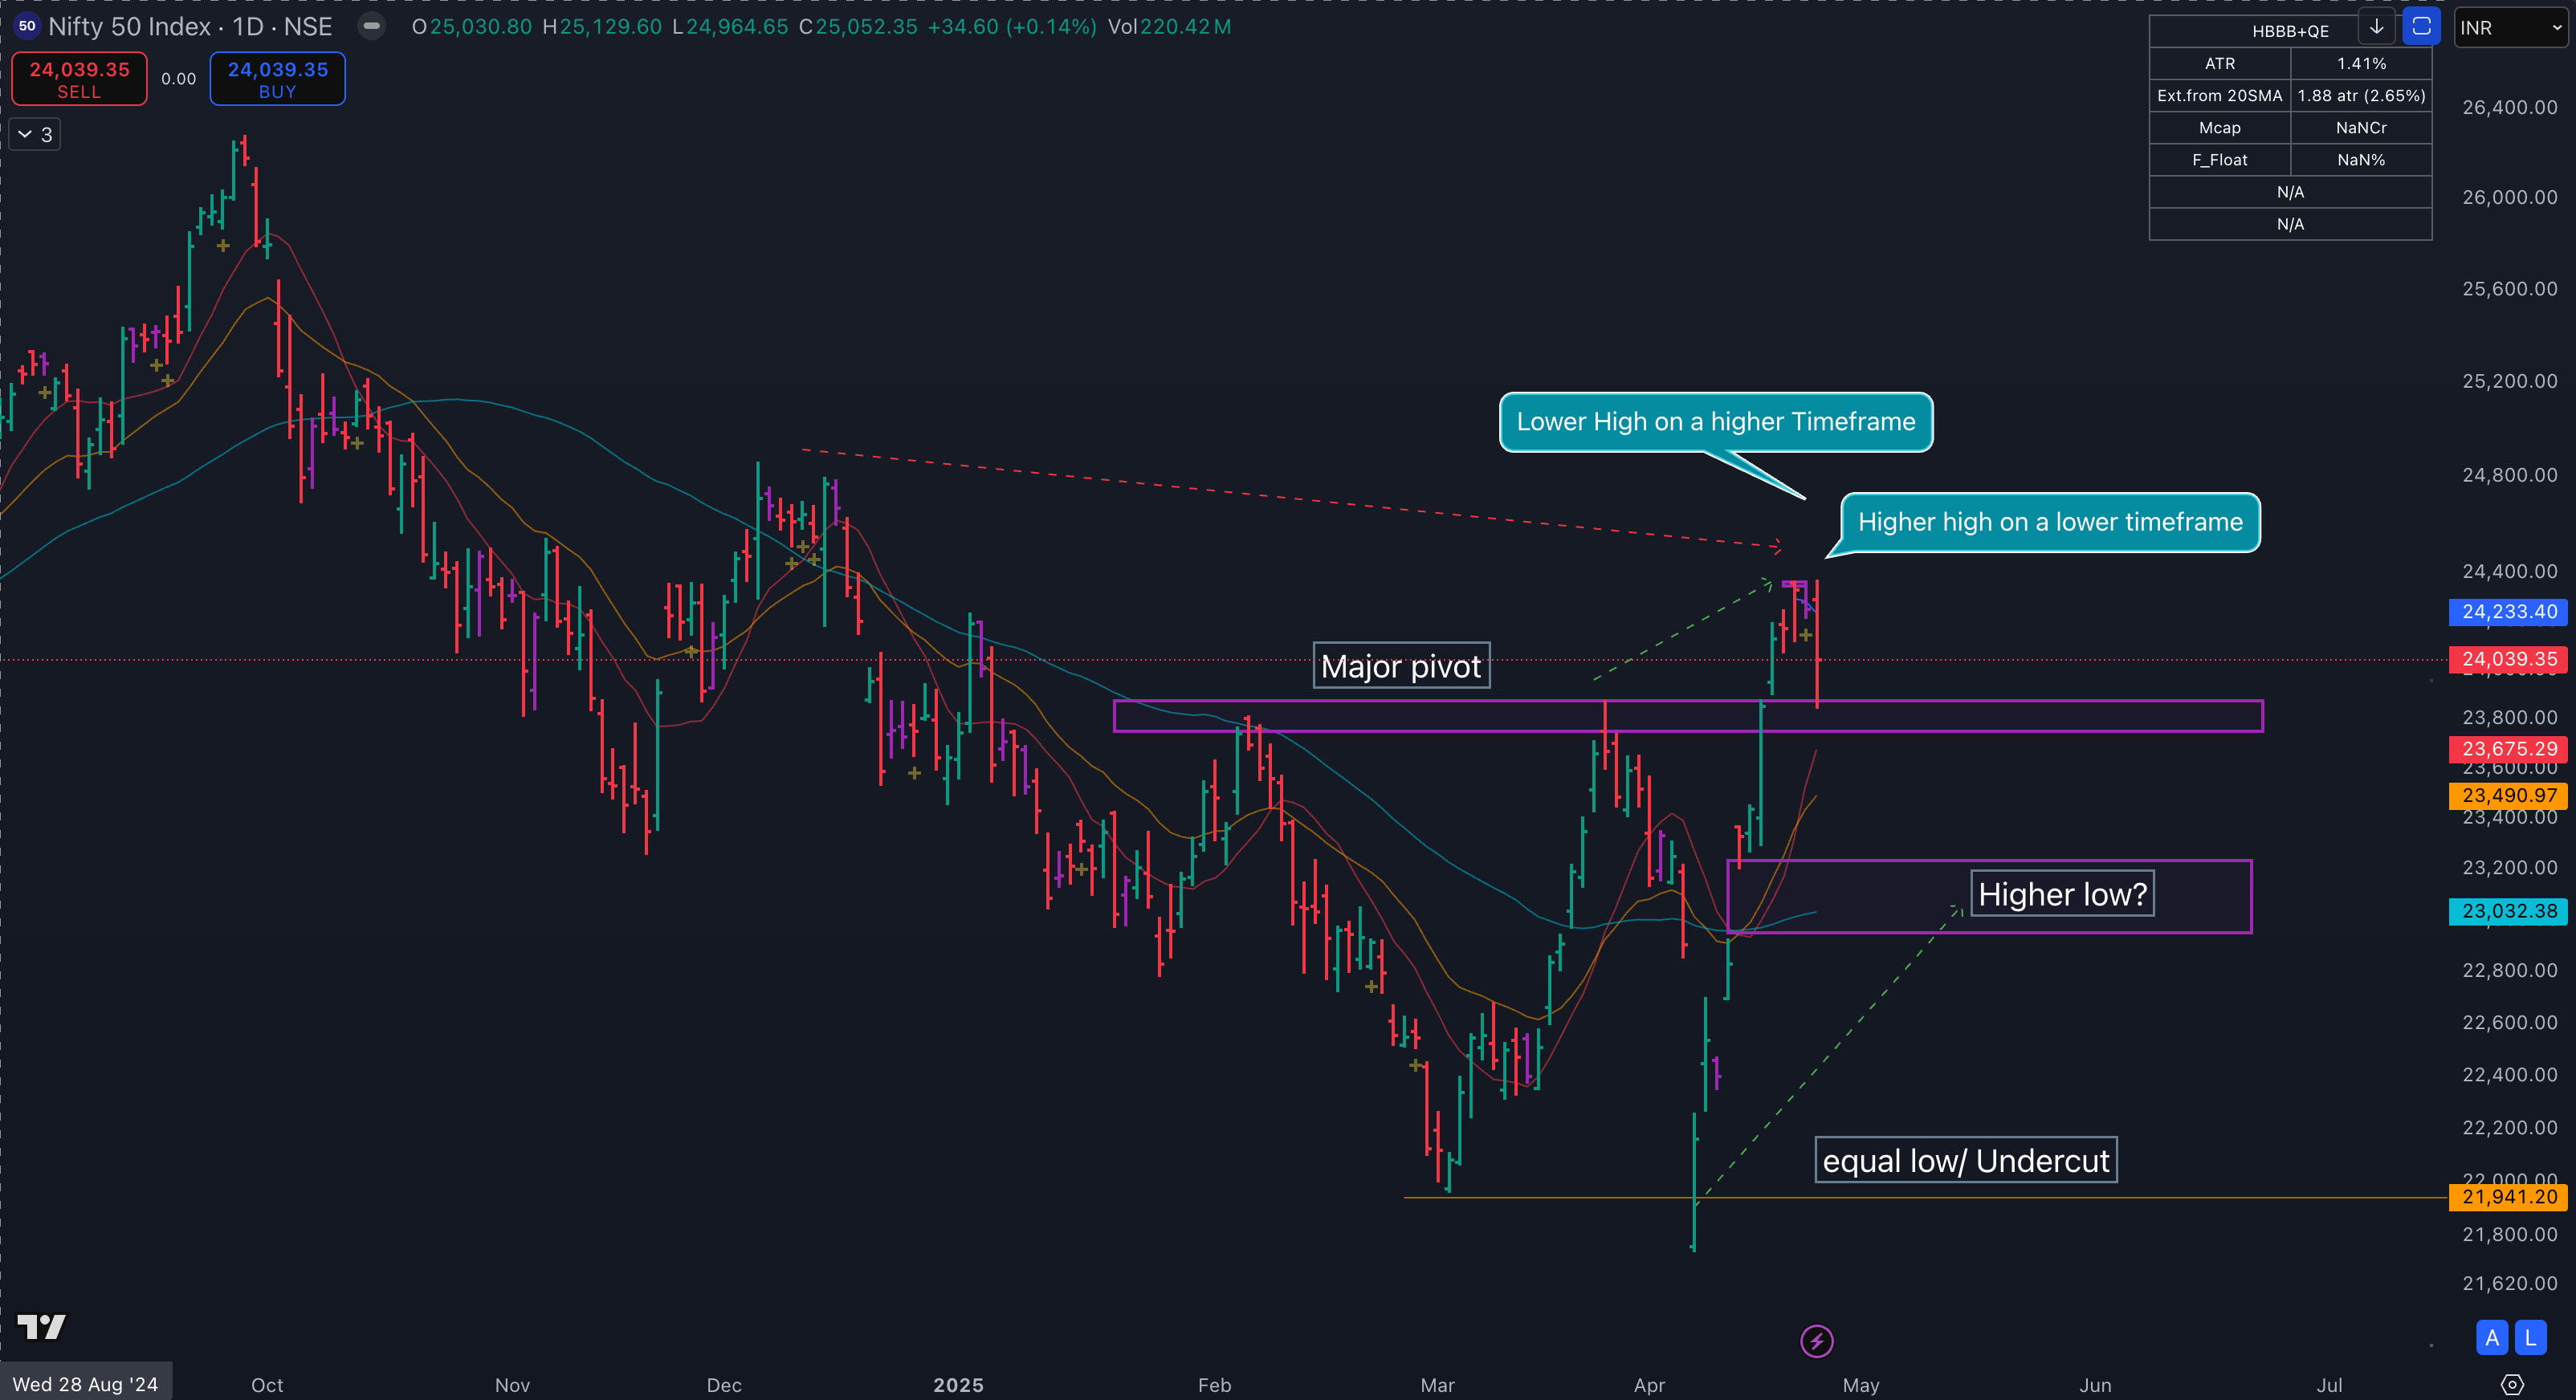
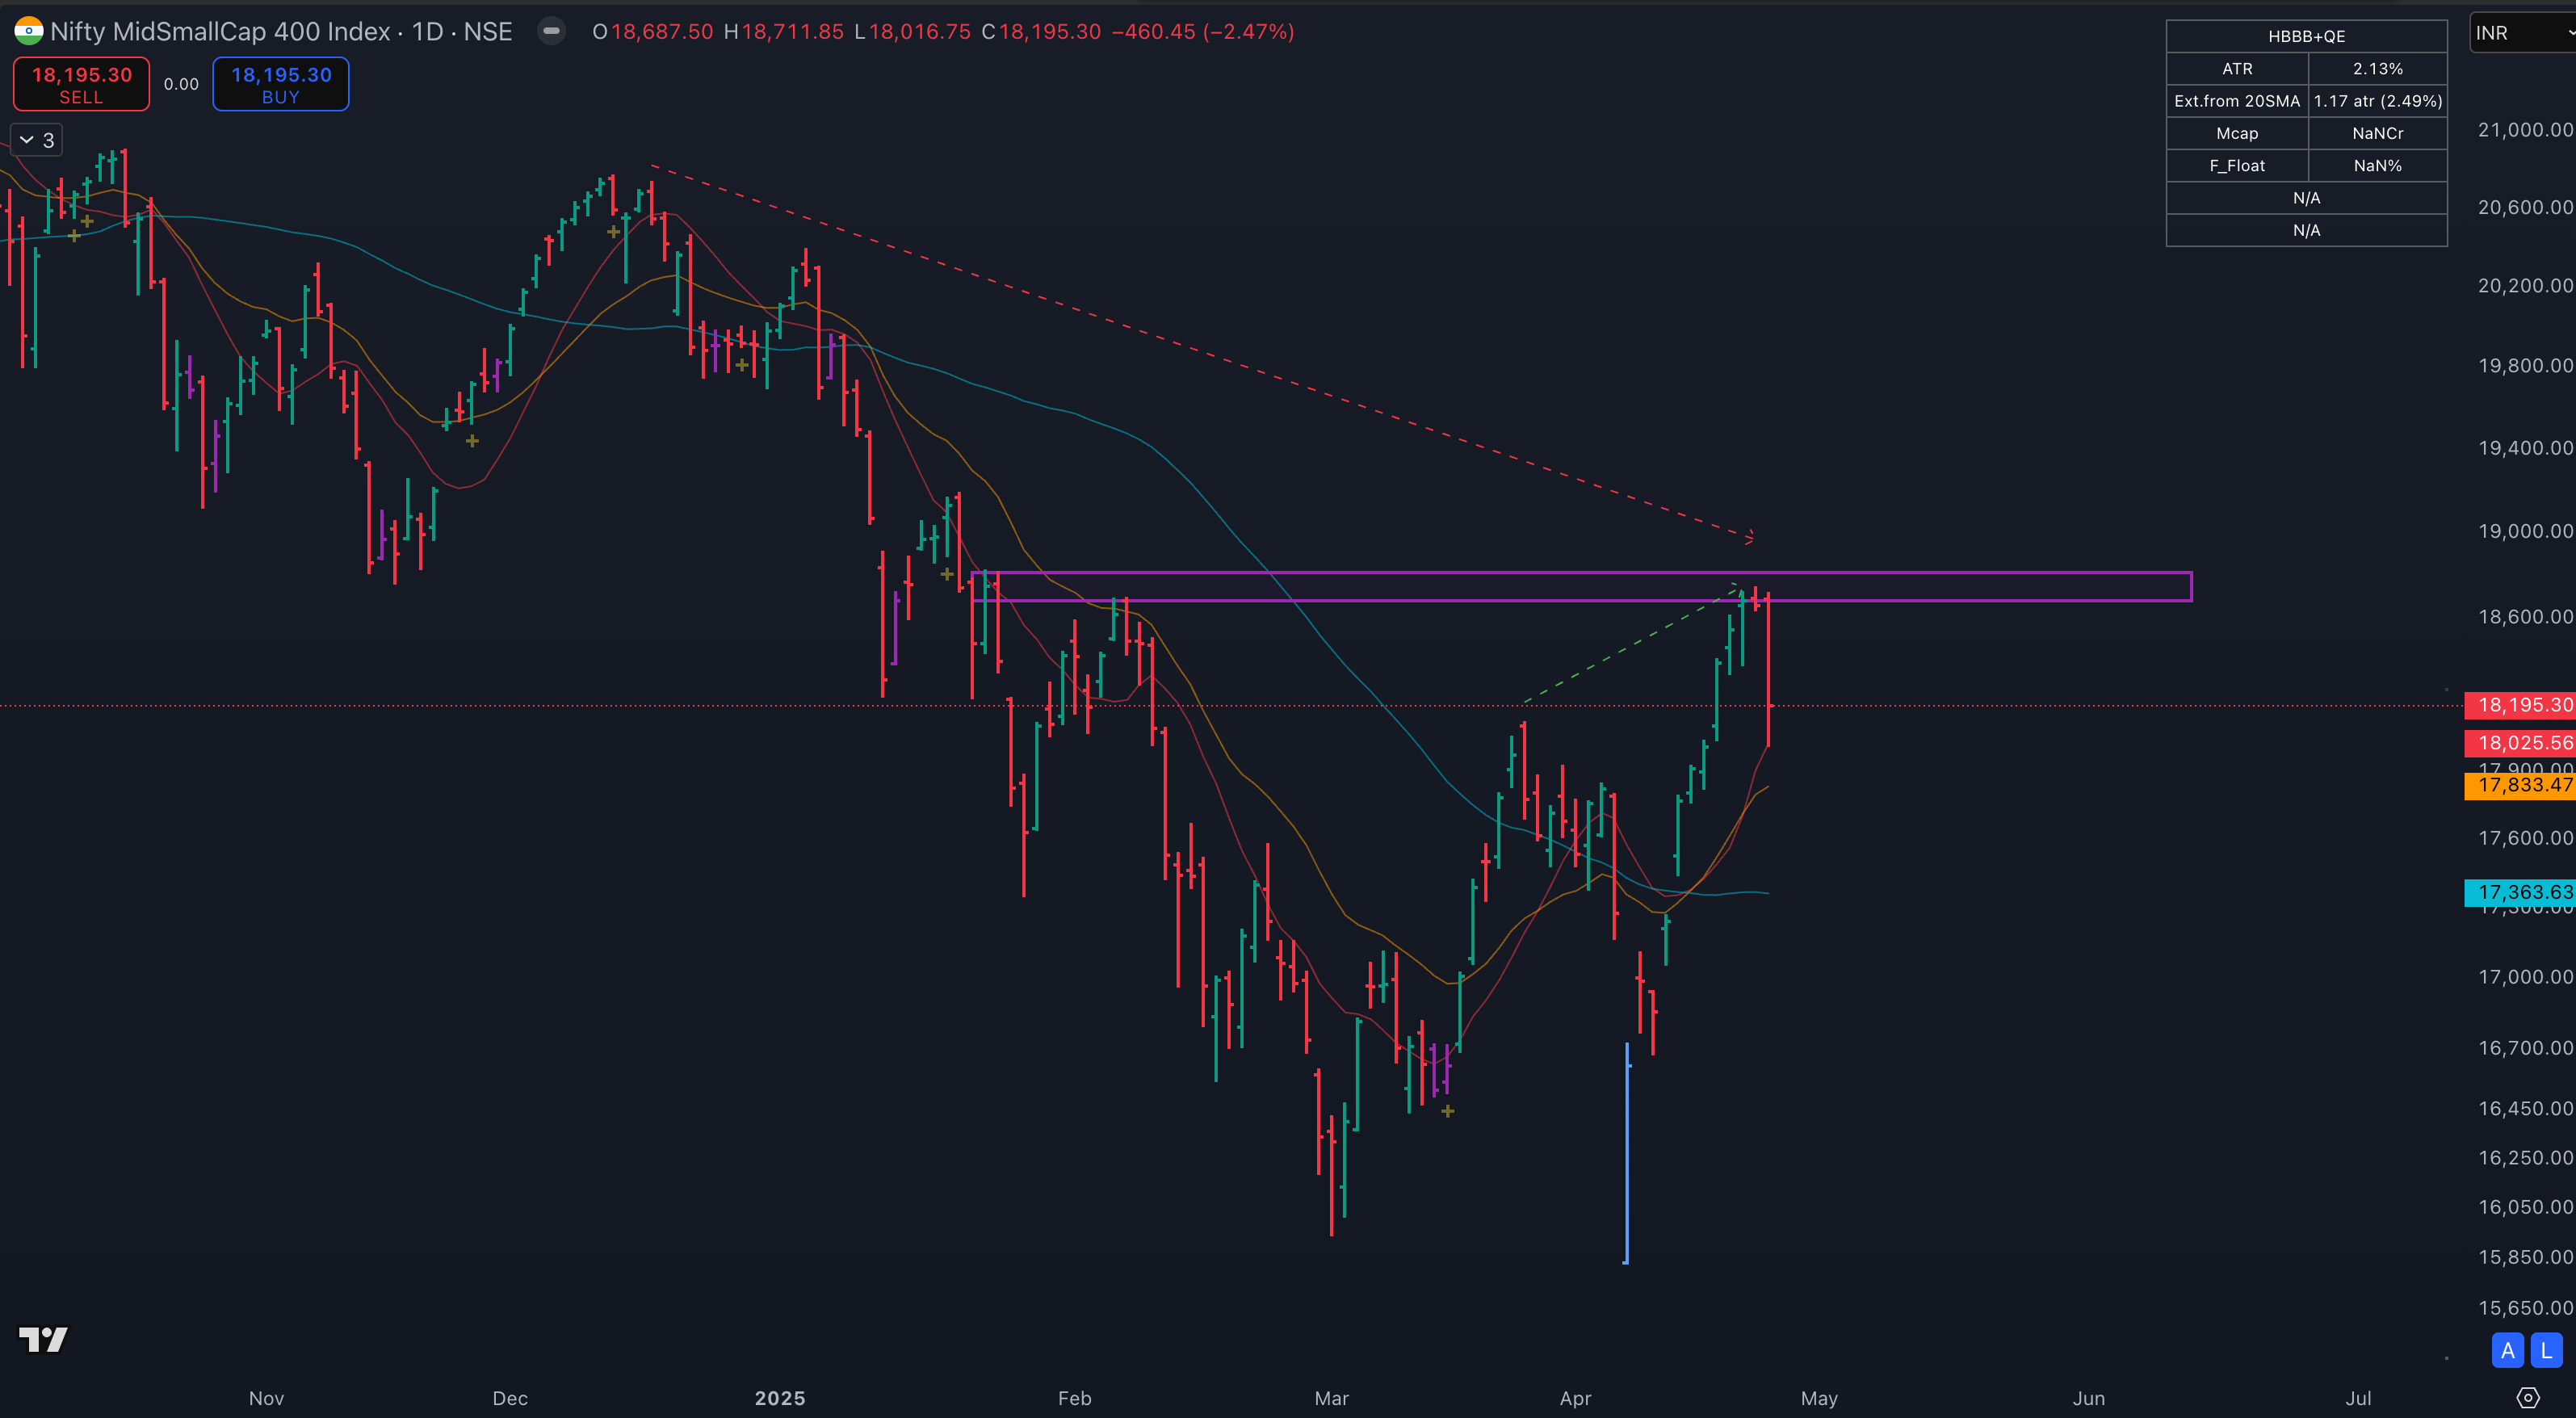
N50:
We have a nascent uptrend after the price broke out of the major pivot last week.
But on a higher timeframe, we still have a downtrend.
For the bias of an uptrend continuation to be strong, we need a Higher low now.
The Gap supported by the 50MA could be an area to watch out.
The shorter key MAs could hold as well.
Currently, just retesting the previous breakout zone.
Could it reverse from here?
I wouldn’t bet against it.
Anticipation:
So, we broke out of a major pivot high and got rejected soon after.
How could things unfold next?
First, we are still trending down on the higher timeframe.
Now that we are on day 1 of the downswing, how far would it go?
As the key MAs are trending up, the bias would be to find support from one of them.
A higher low would bode well for what looks like a big stage 1 reversal base.
Positional bias is still NO money this week.
PS: Anticipations are often wrong, and biases should be adjusted after every candle.
If you dont know this already, I update my Market MATH every day on my website under the BREADTH section. Please check in every day post-market.
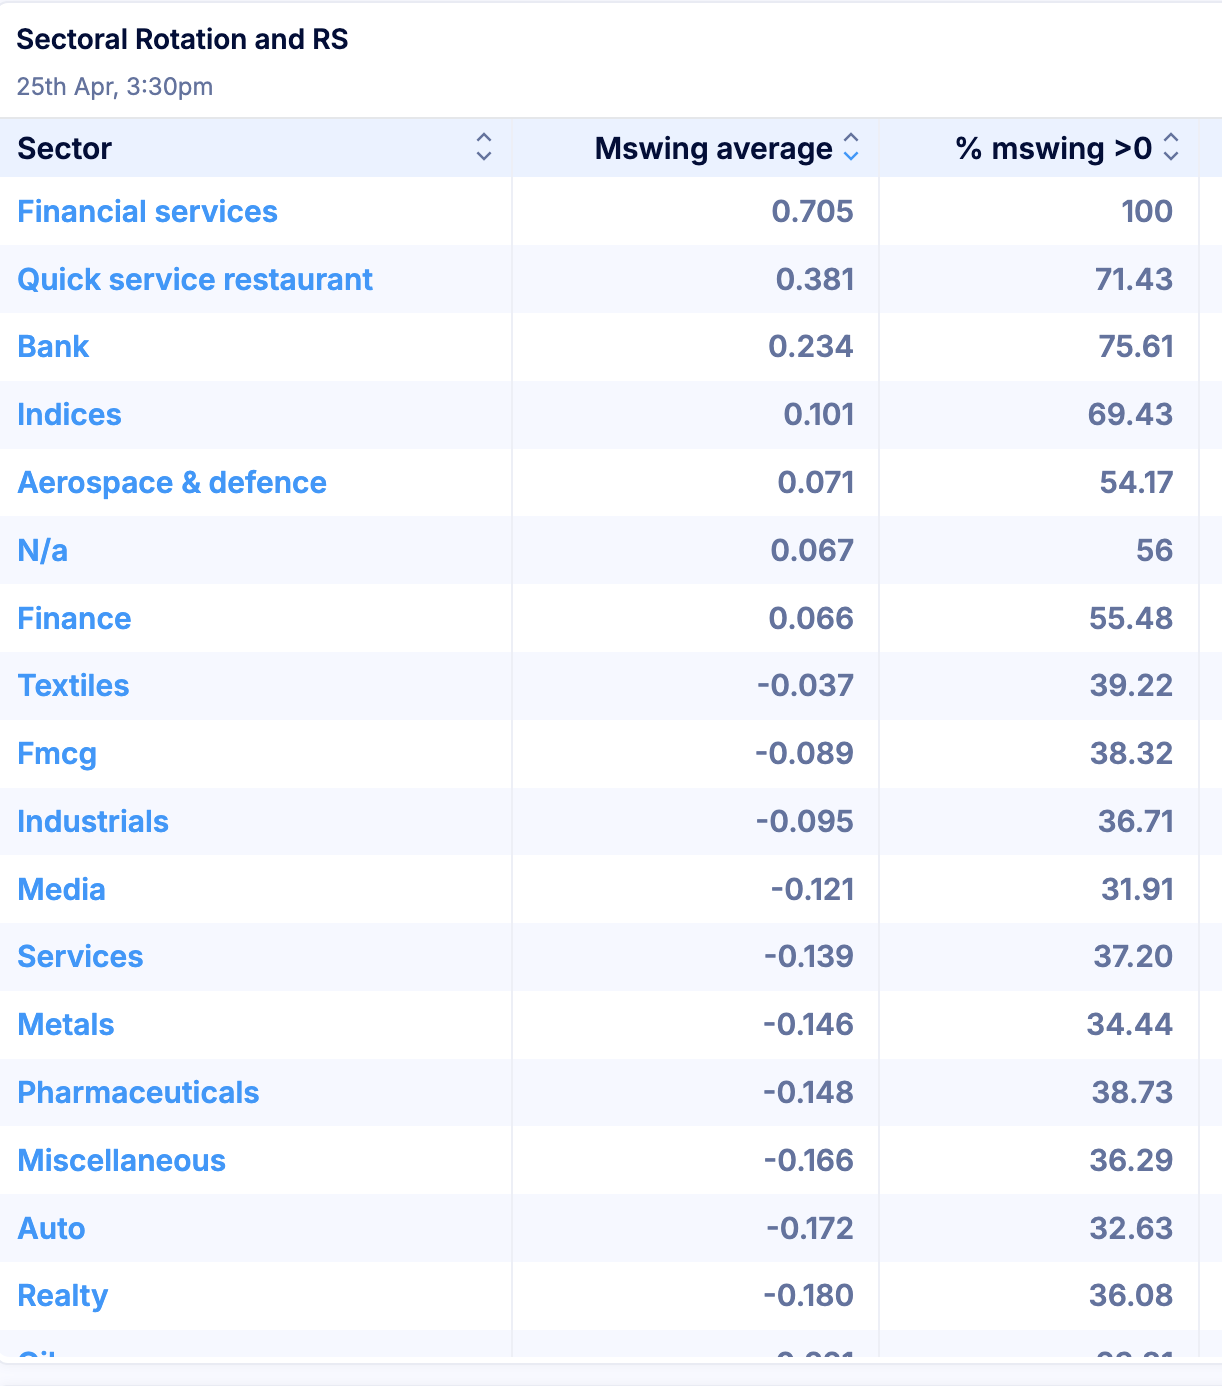
Group Strength:
Sectoral:
Banks and Financials.
Index:
Indices paint the same picture.
Financials and Banks

Watchlists:
Follow the Strongest Stocks (the RS 100 and RS 100 Liquid watchlists below):
Find Tightness candidates from Tandem Inside bars and Tandem Low ranges.
https://www.sakatashomma.com/scanners
Find my curated Tight watchlist for the week below.
Watchlist(s) below
Keep reading with a 7-day free trial
Subscribe to The Technical Take to keep reading this post and get 7 days of free access to the full post archives.