


Market MATH & Watchlist: 22-Dec-2024
Bias: Of an Oversold bottom sometime next week.

MATH: Momentum Anticipation and Trend by Homma:
MATH last week: Click the link
The most comprehensive article on Breadth and Anticipation:

As technical traders, We
“Anticipate, but confirm. Wish, but only react.”
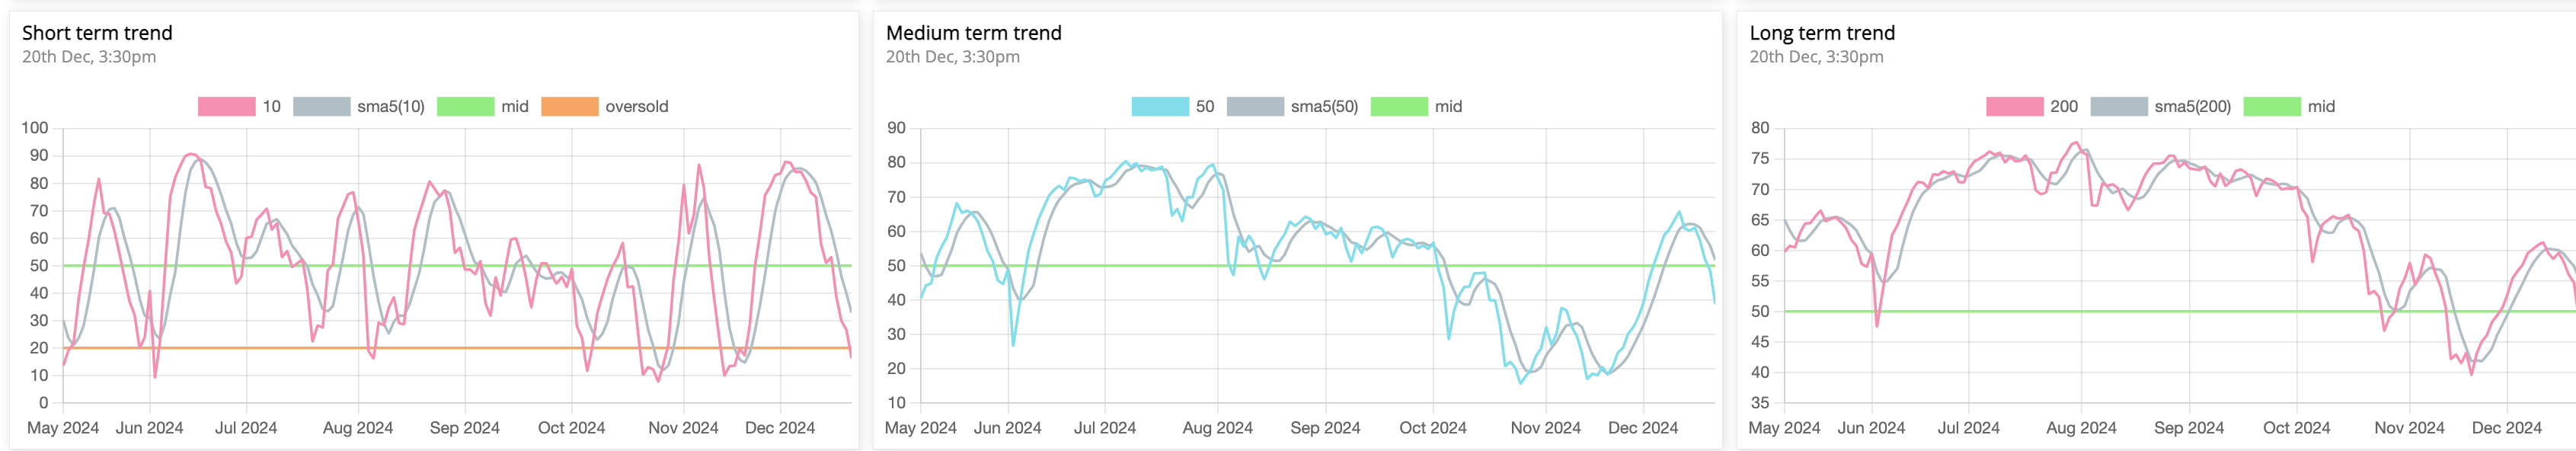
Trend:
Short-term: “Percentage of stocks above 10-DMA”
Medium-term: “Percentage of stocks above 50-DMA”
Long-term: “Percentage of stocks above 200-DMA”
Short-term we are nearing the oversold levels.
Medium-term is below 50 hence bearish.
Long-term approaching the 50 levels.
Momentum: Homma Mswing Score
The Mswing score is now decreasing.
Same trend on the Landry Score:
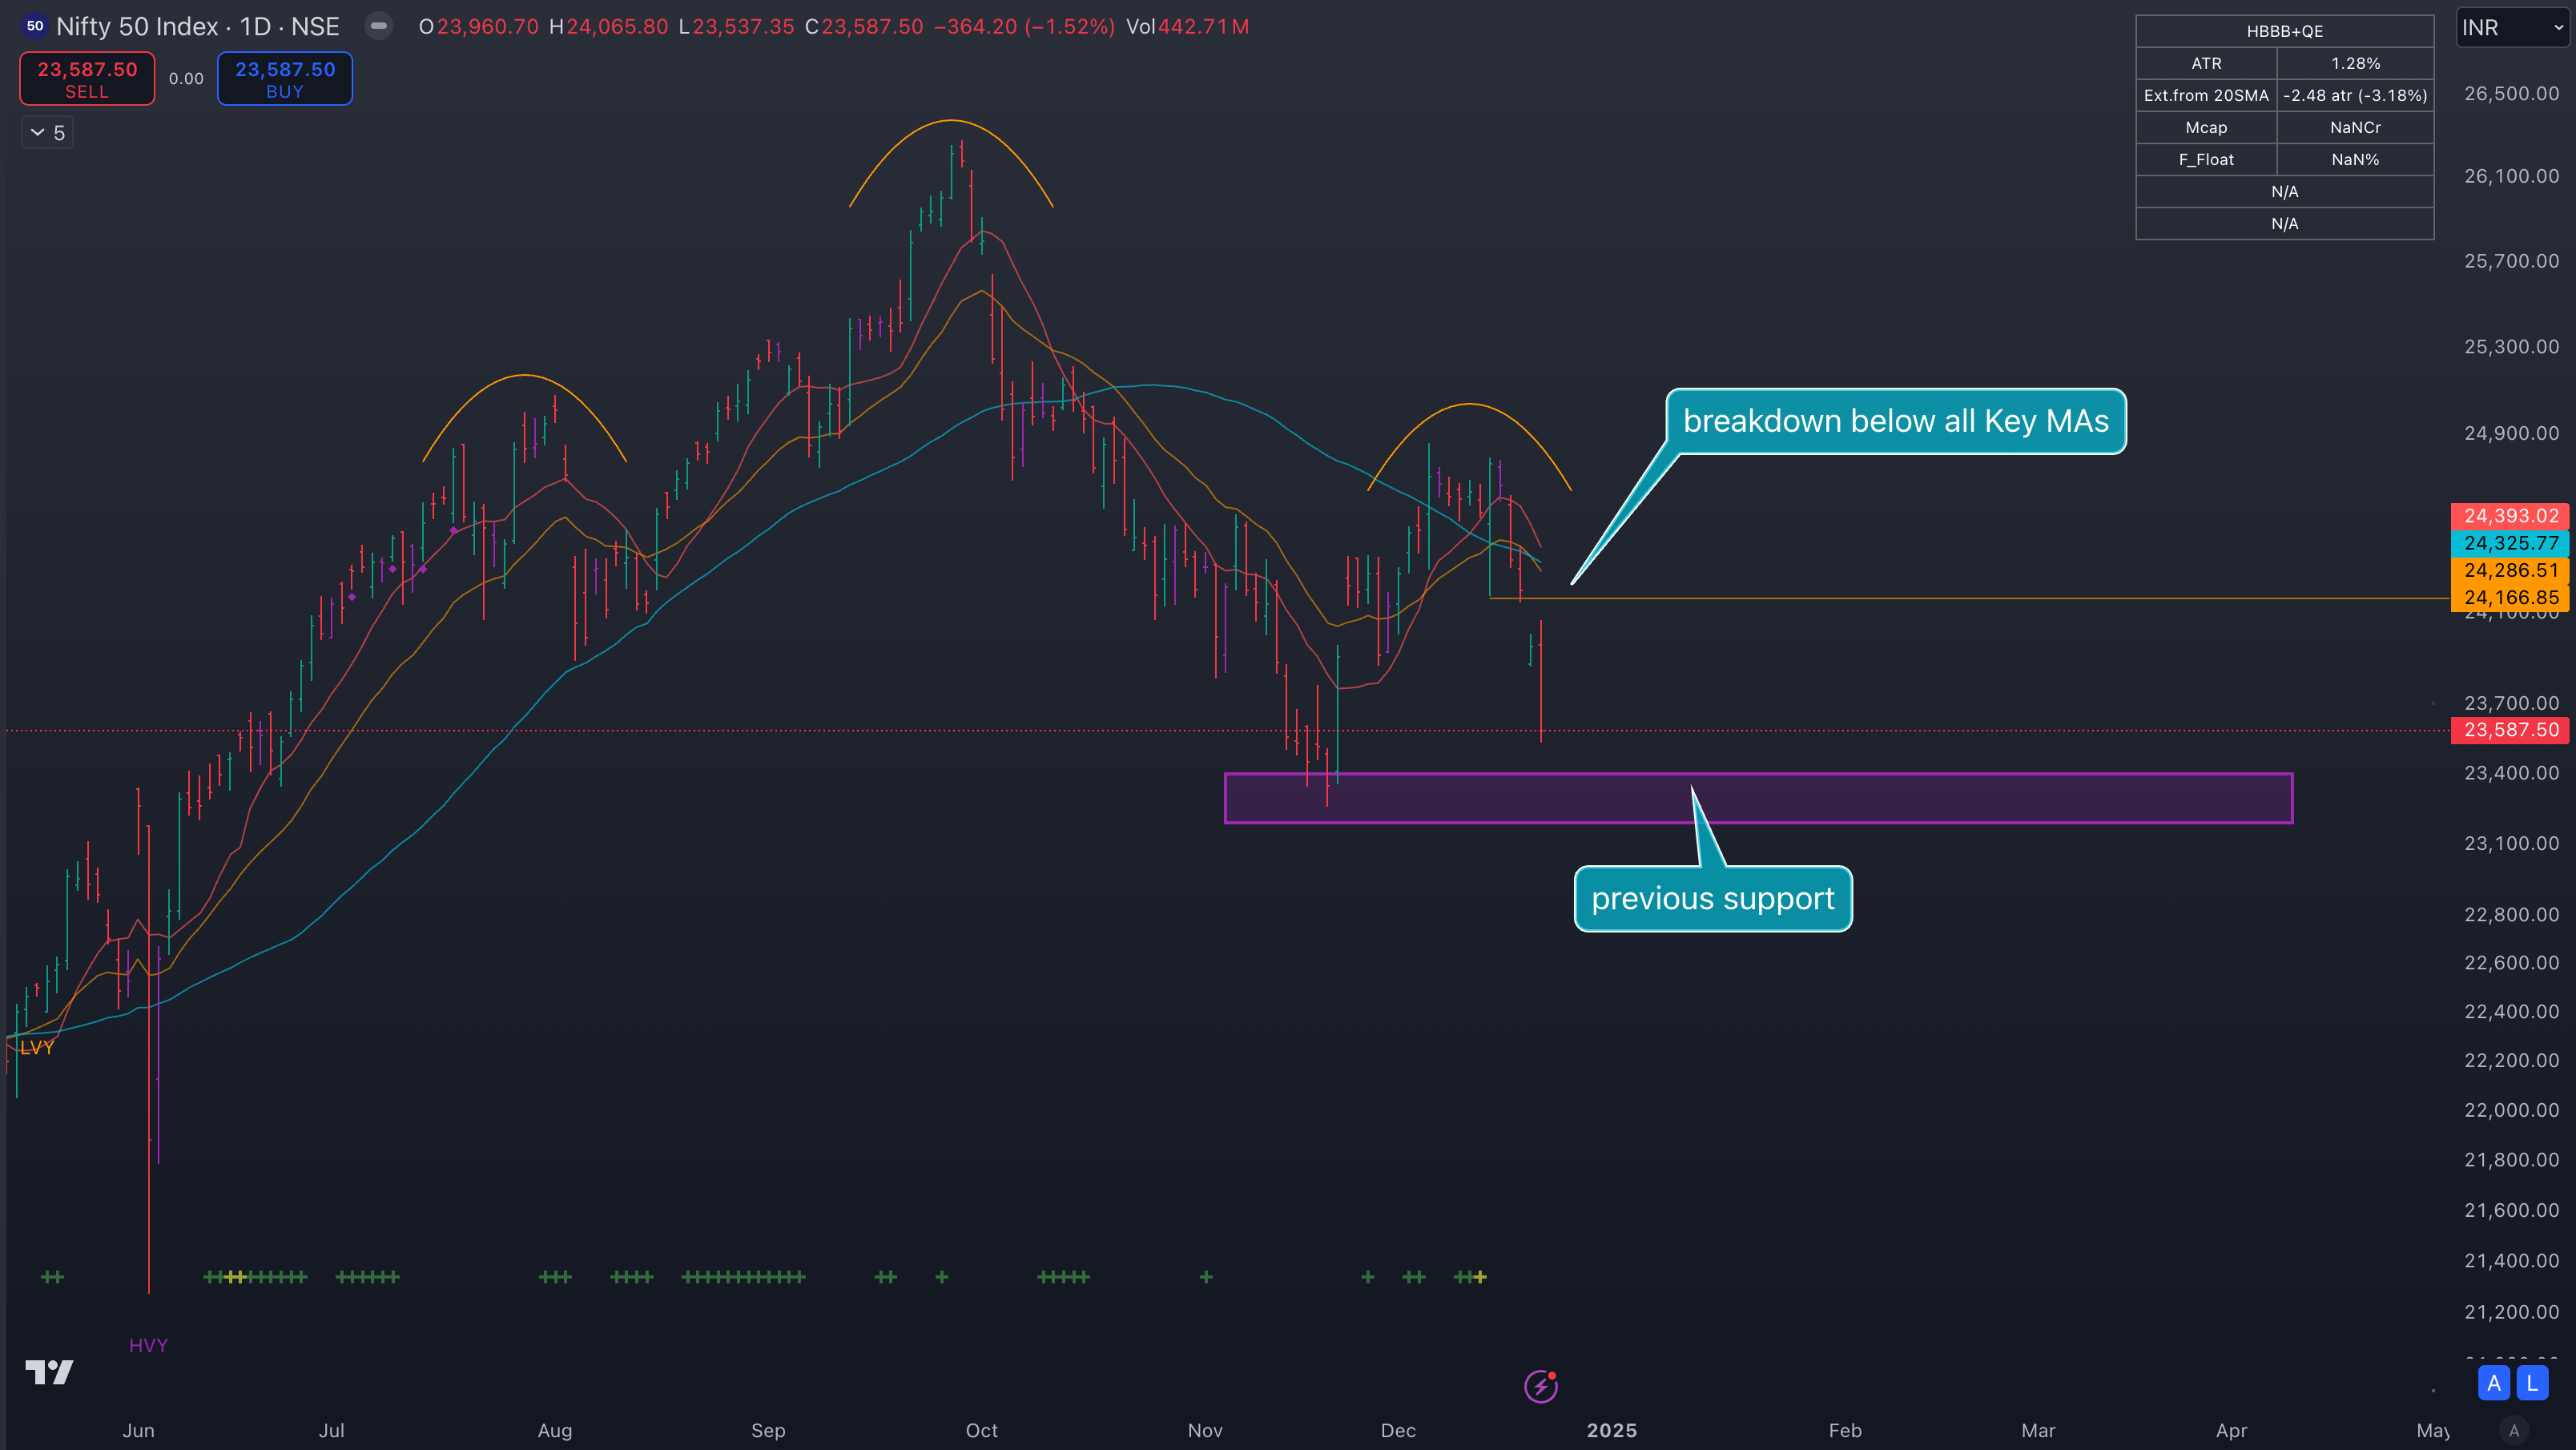
N50:
The index is now below all key MAs.
But hovering near the big swing low which is a key Support level.
N500:
Same as N50.
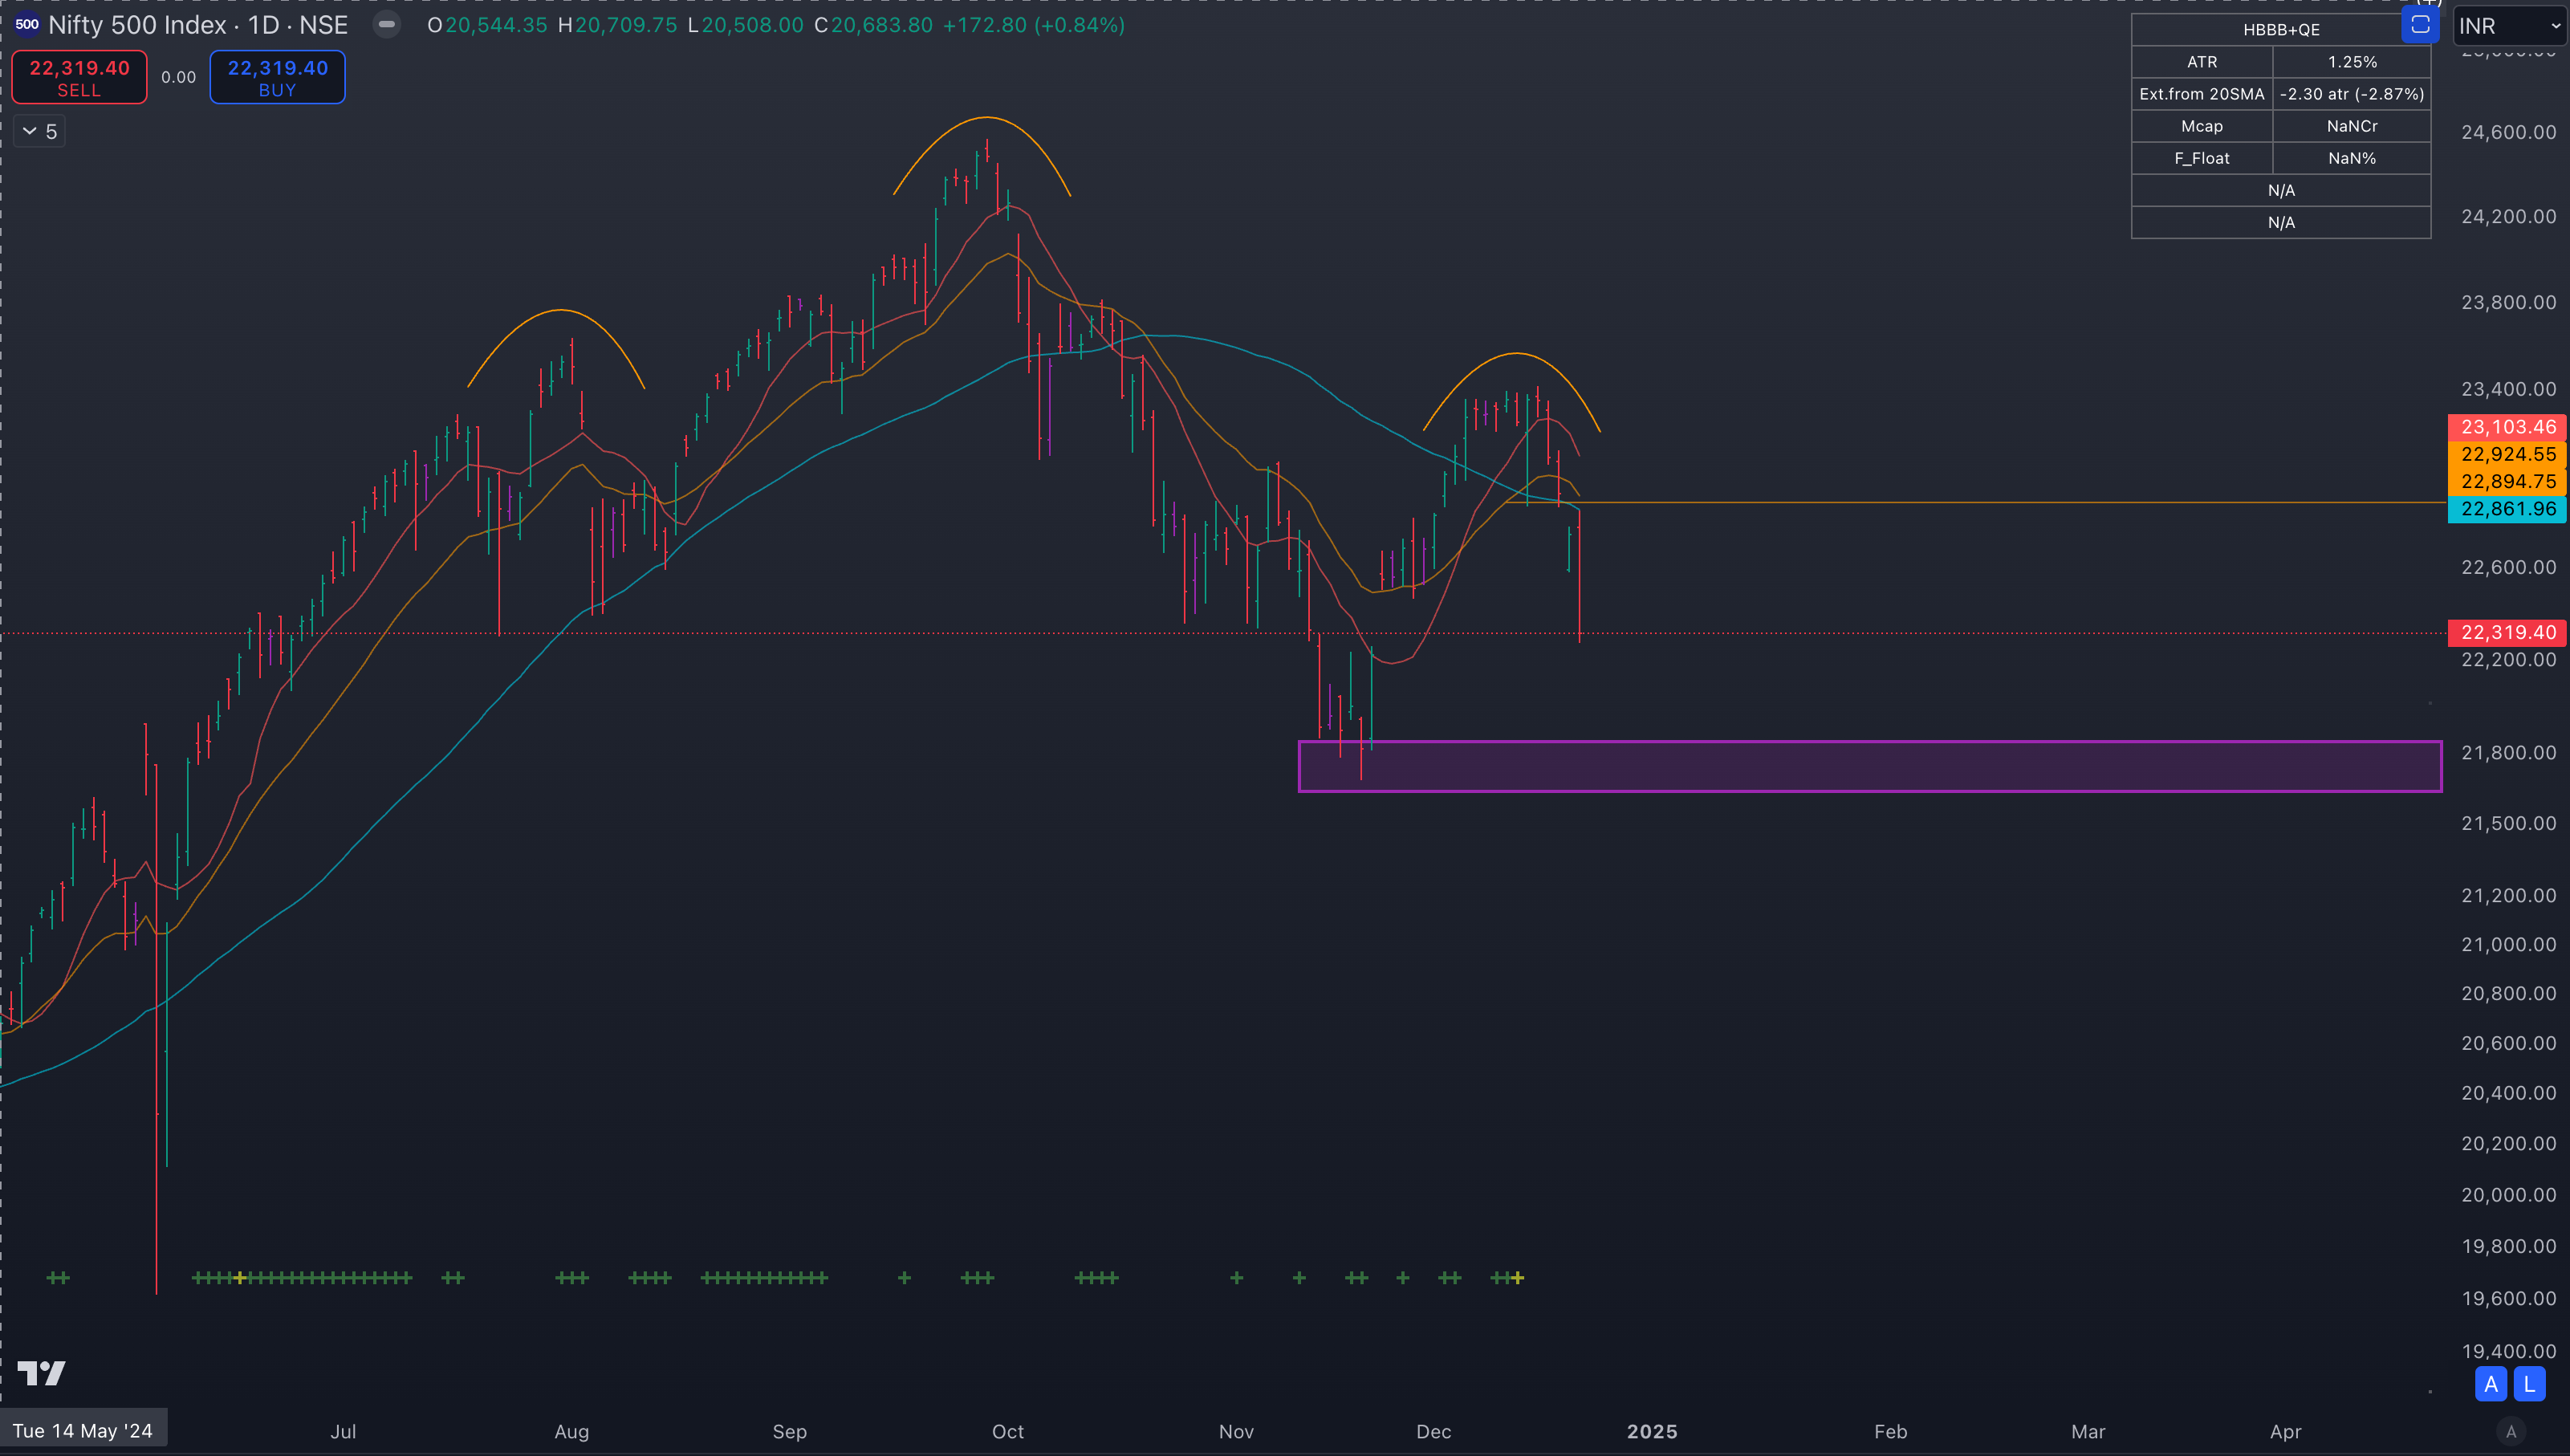
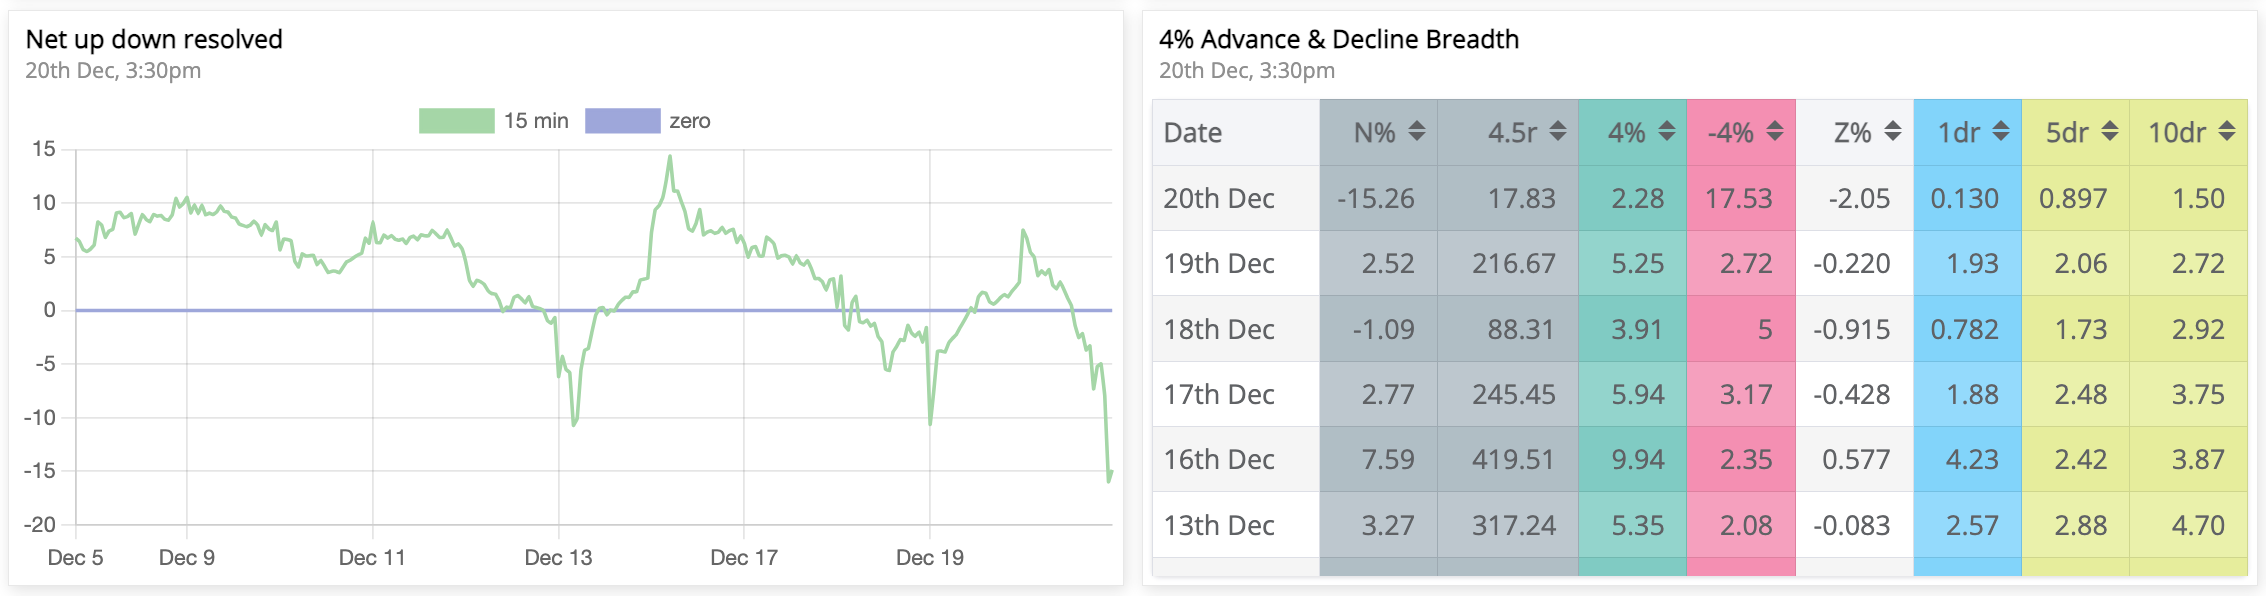
Net4% Movers:
The Net4% plot started to show weakness from 17th December and closed at the most bearish closing on the weekly close.
Anticipation:
As anticipated, we pulled back to the key MAs and found good support at the levels during the closing last week.
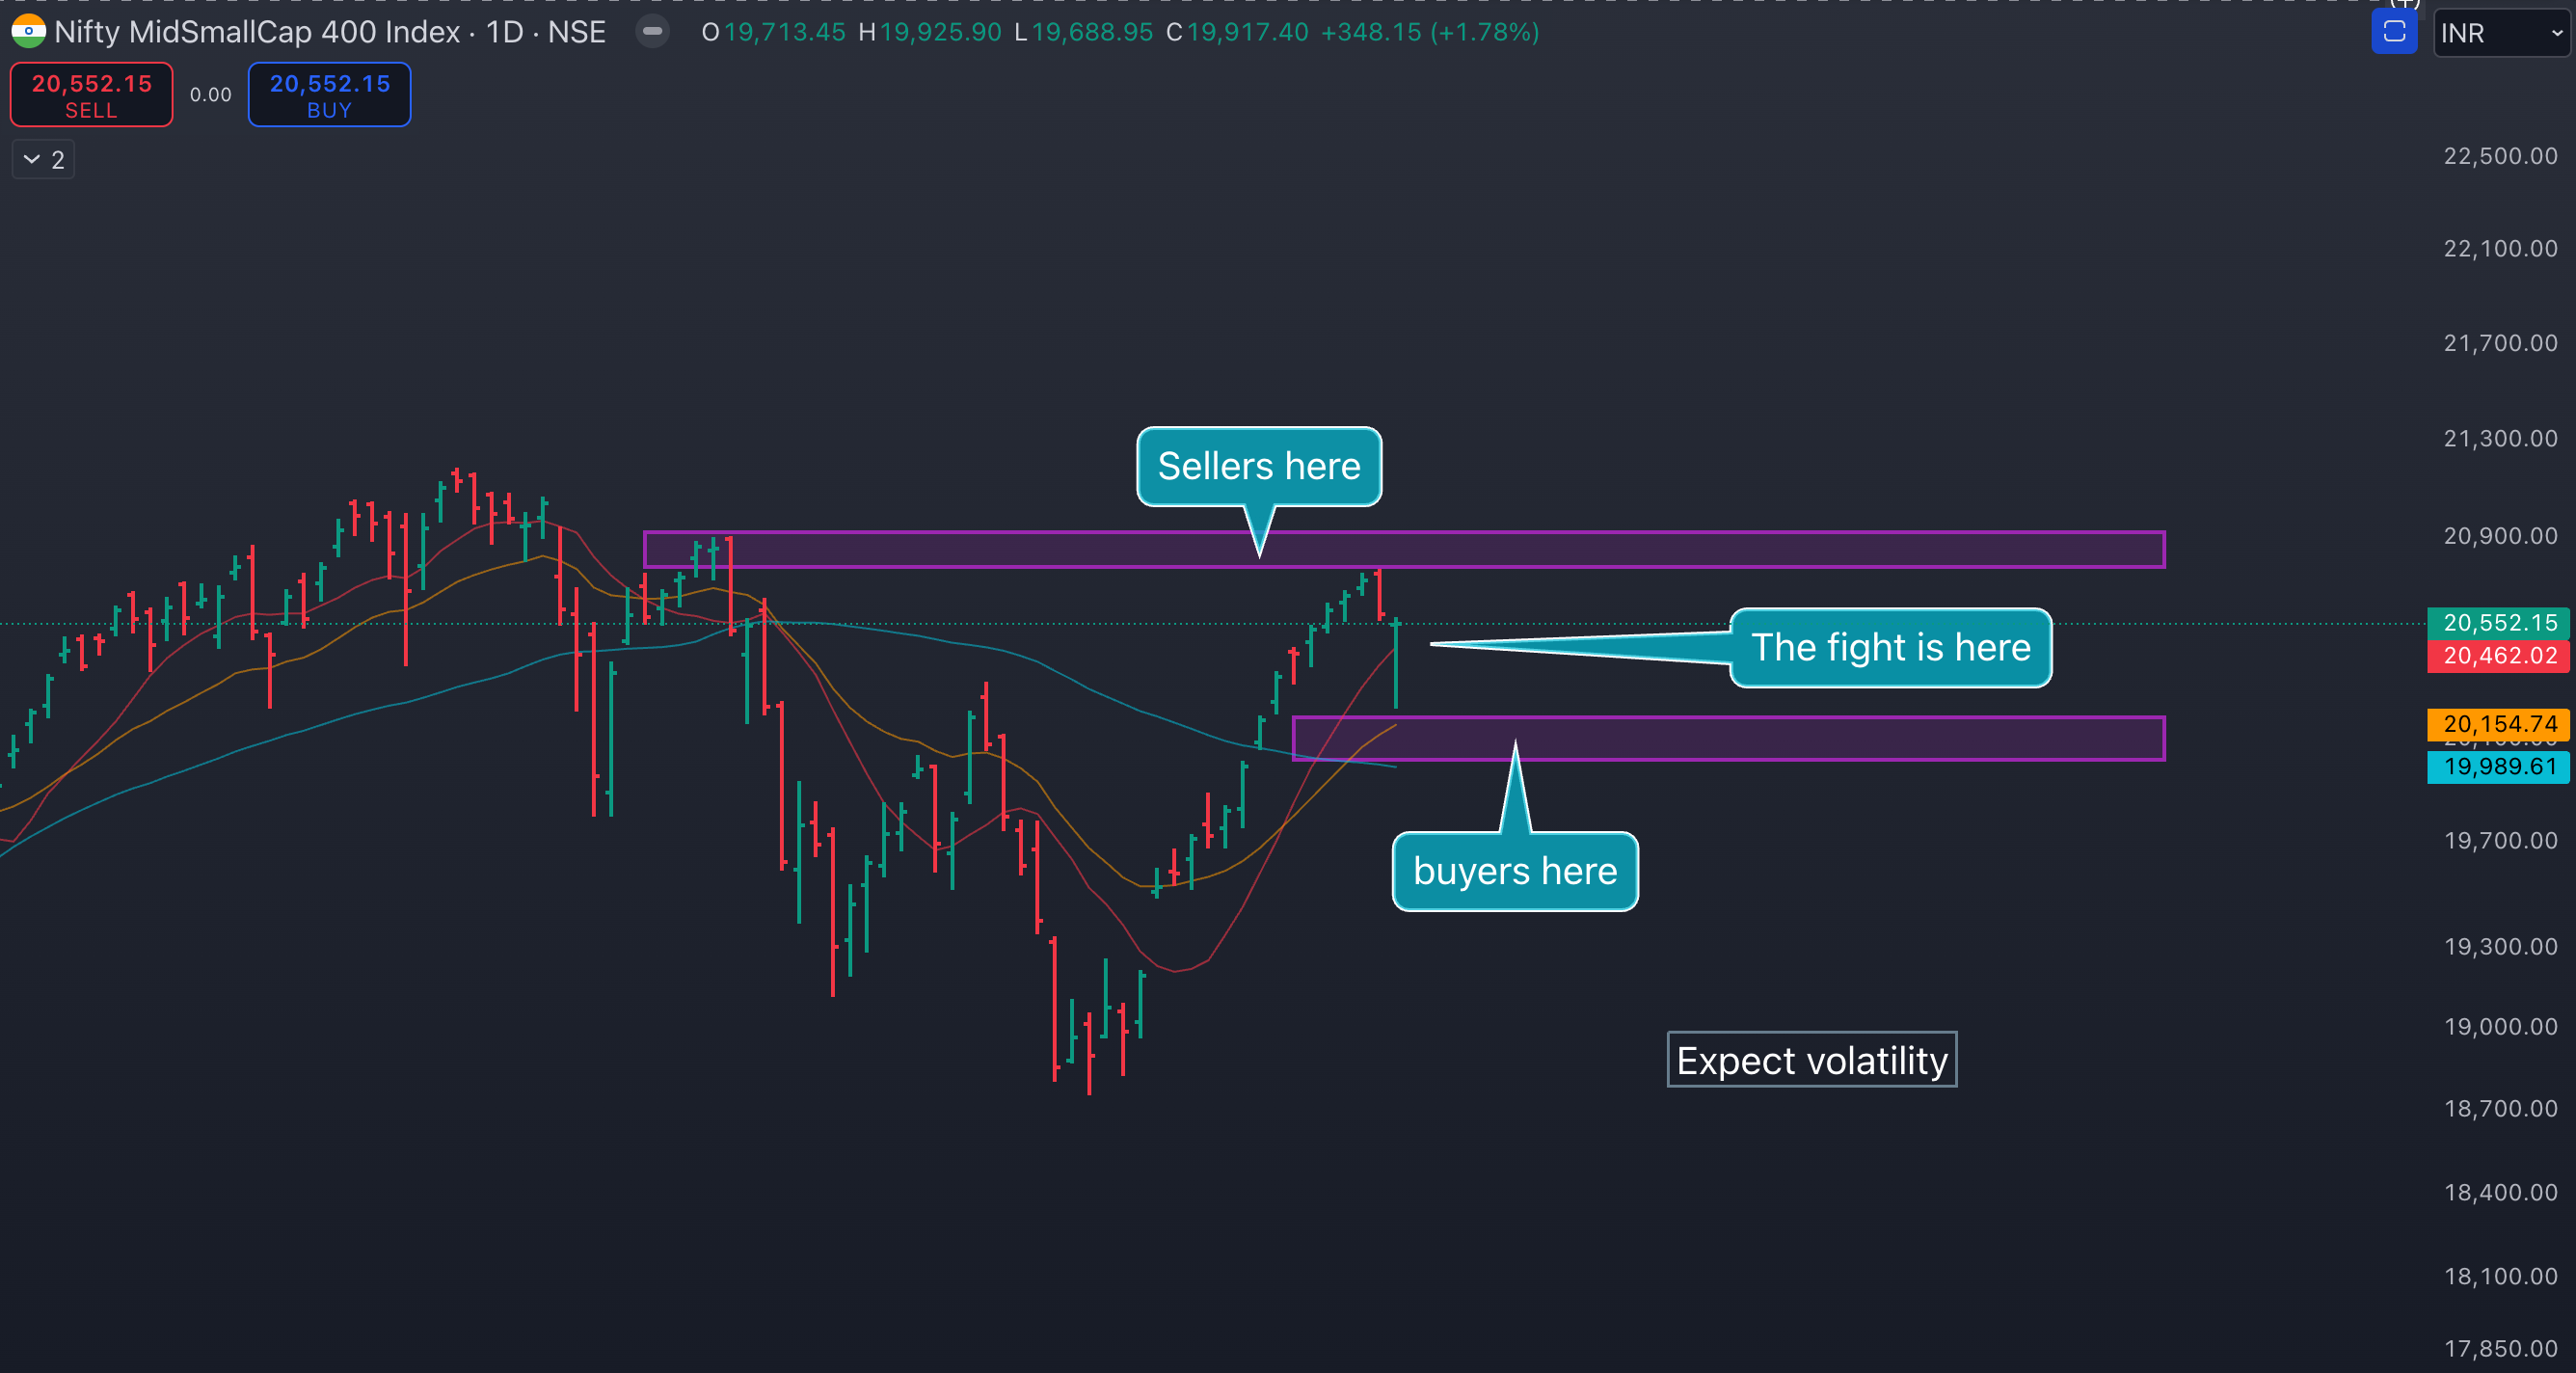
However, sellers were strong and took the price below the anticipated support levels.
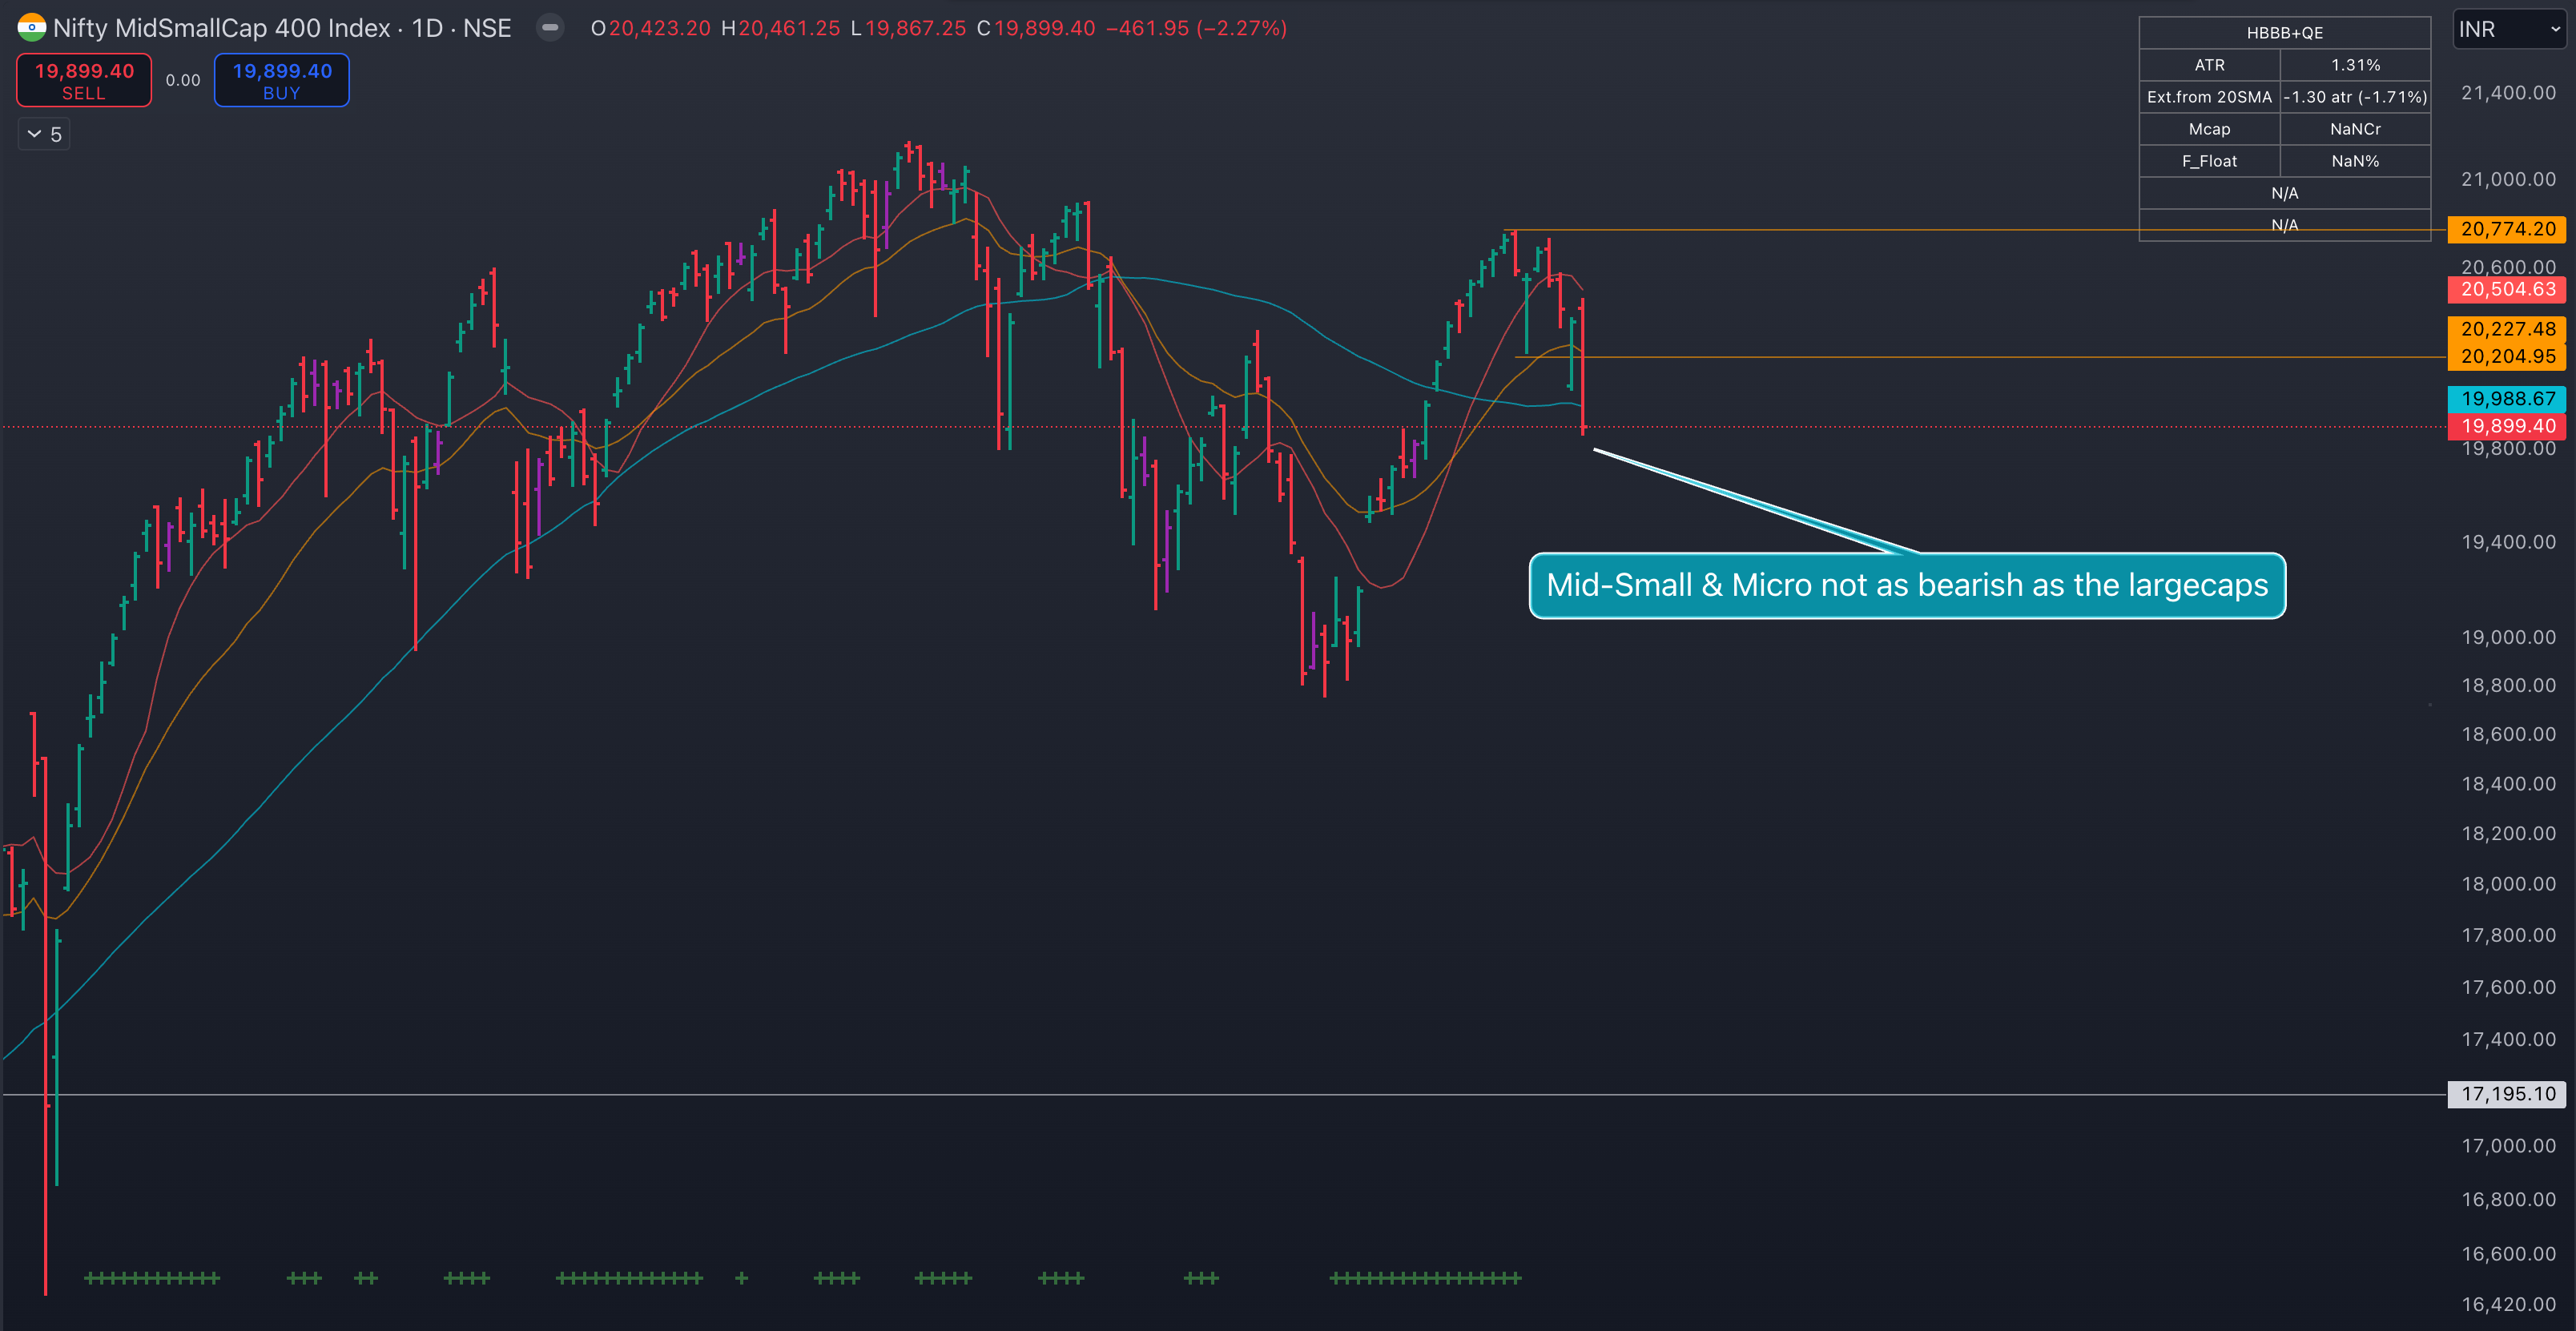
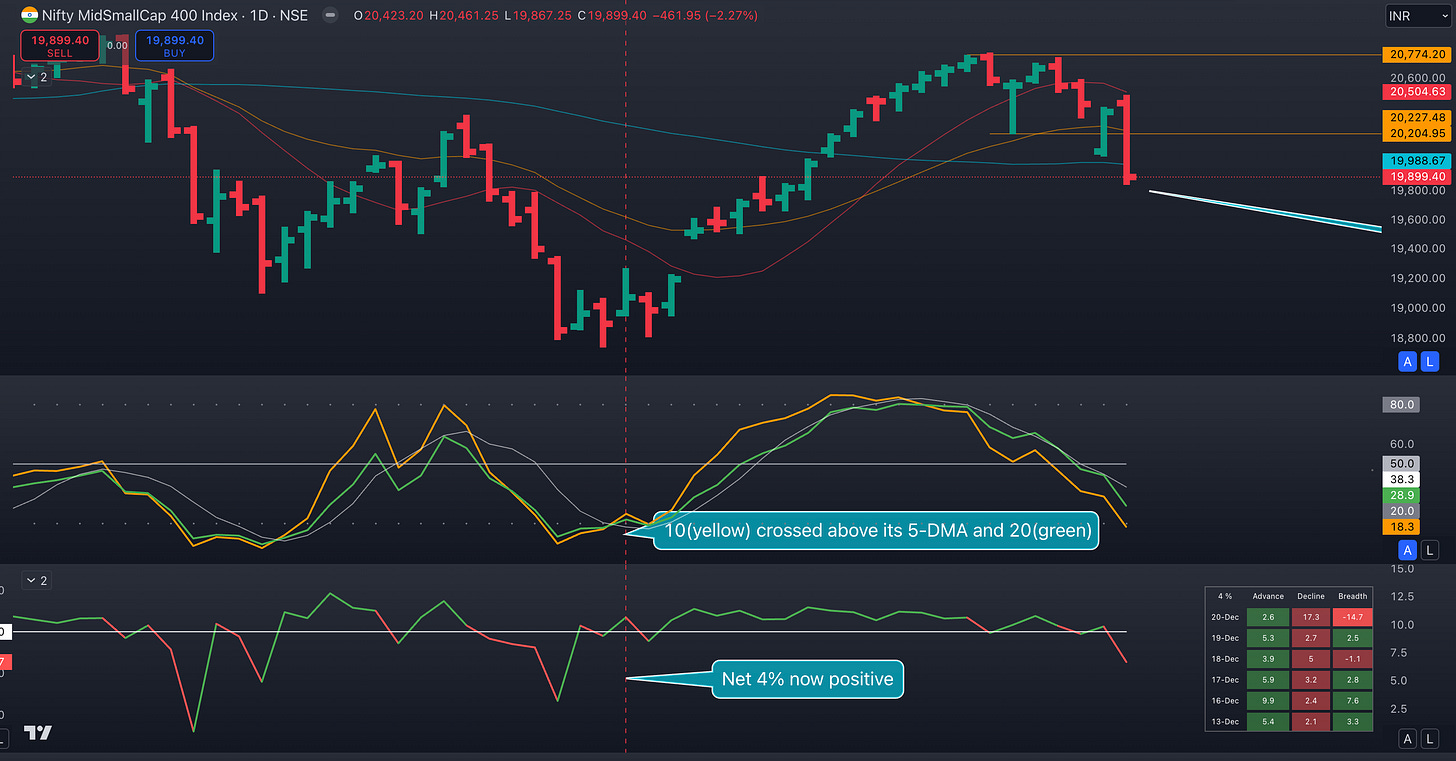
The mid-small cap index is also below all key MAs now, although it doesn’t look as bearish as its Large-Cap counterparts.
I, therefore, have a bullish bias here.
Having said that, I would wait for the breadth to improve and momentum to show an increase before piling on more risk.
Here is what I would be looking for:
The “% of stocks above 10-DMA” to curl up above the oversold zone, cross above its 5-DMA (and cross above the “% of stocks above 20-DMA”. I learned this observation from Nitin recently).
The Mswing and Landry momentum plots to put higher prints.
The Net4% to print positive scores.
These are often very very signals.
They appeared on the 19th of November on the last bounce while strength was more apparent in three daily candles later on the 25th.
It is important to mention that the downside to acting on early signals is that they could be false signals.

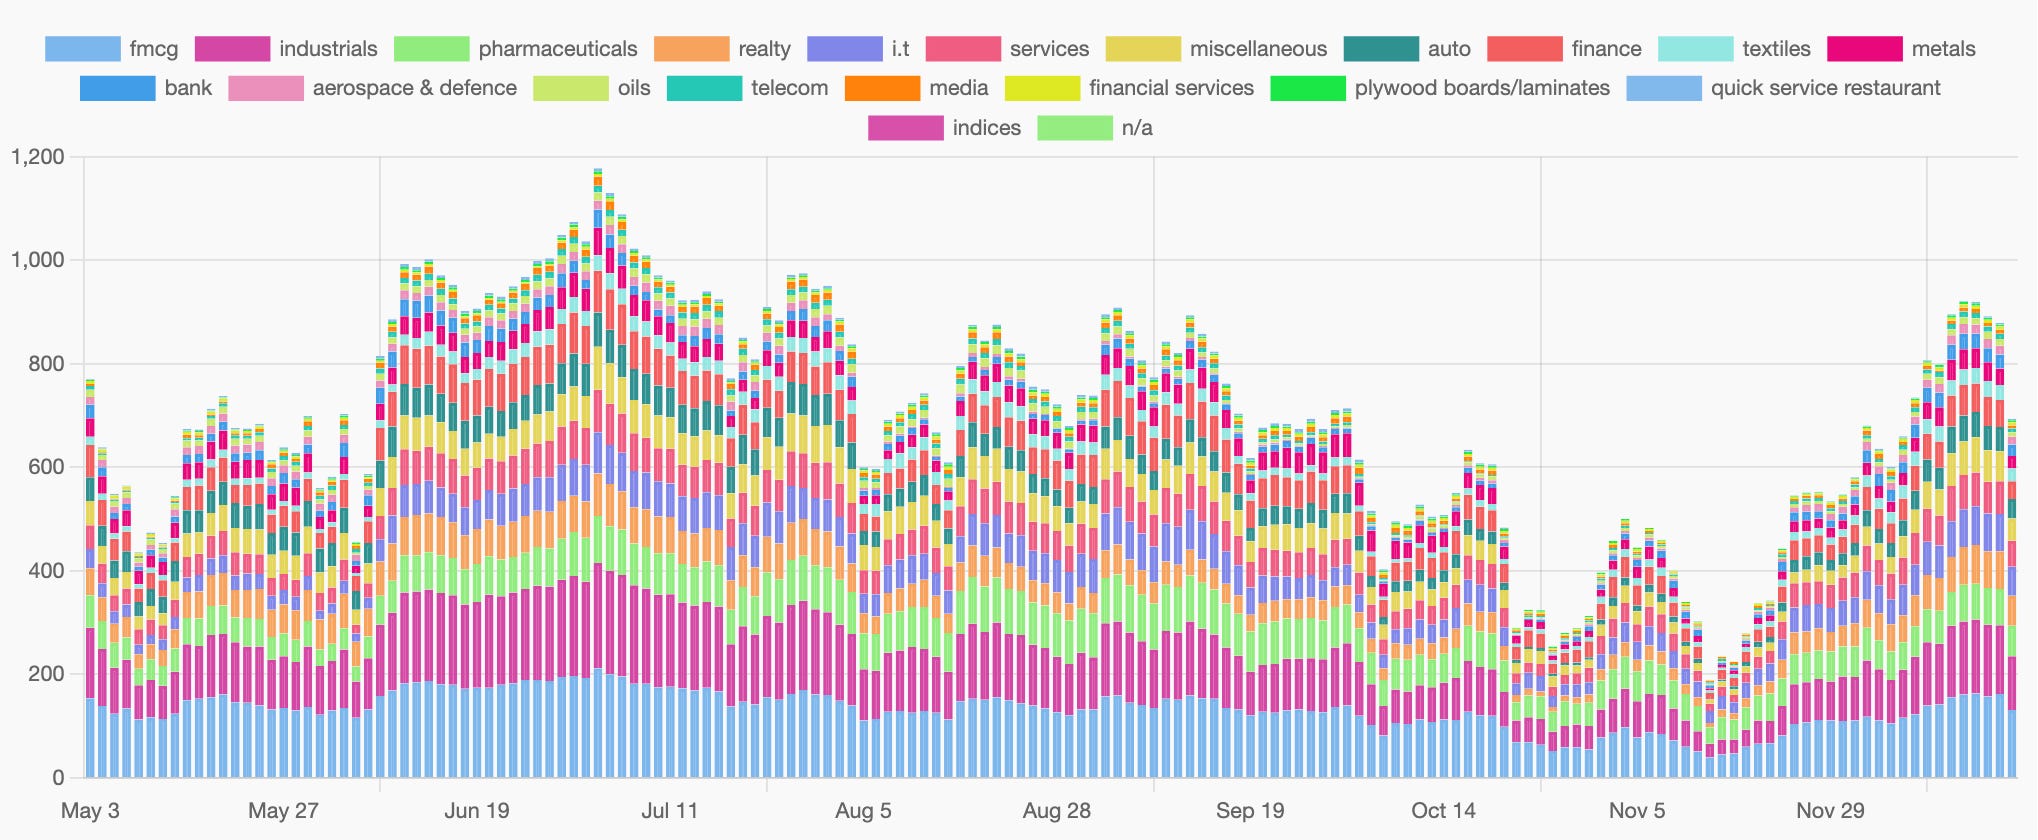
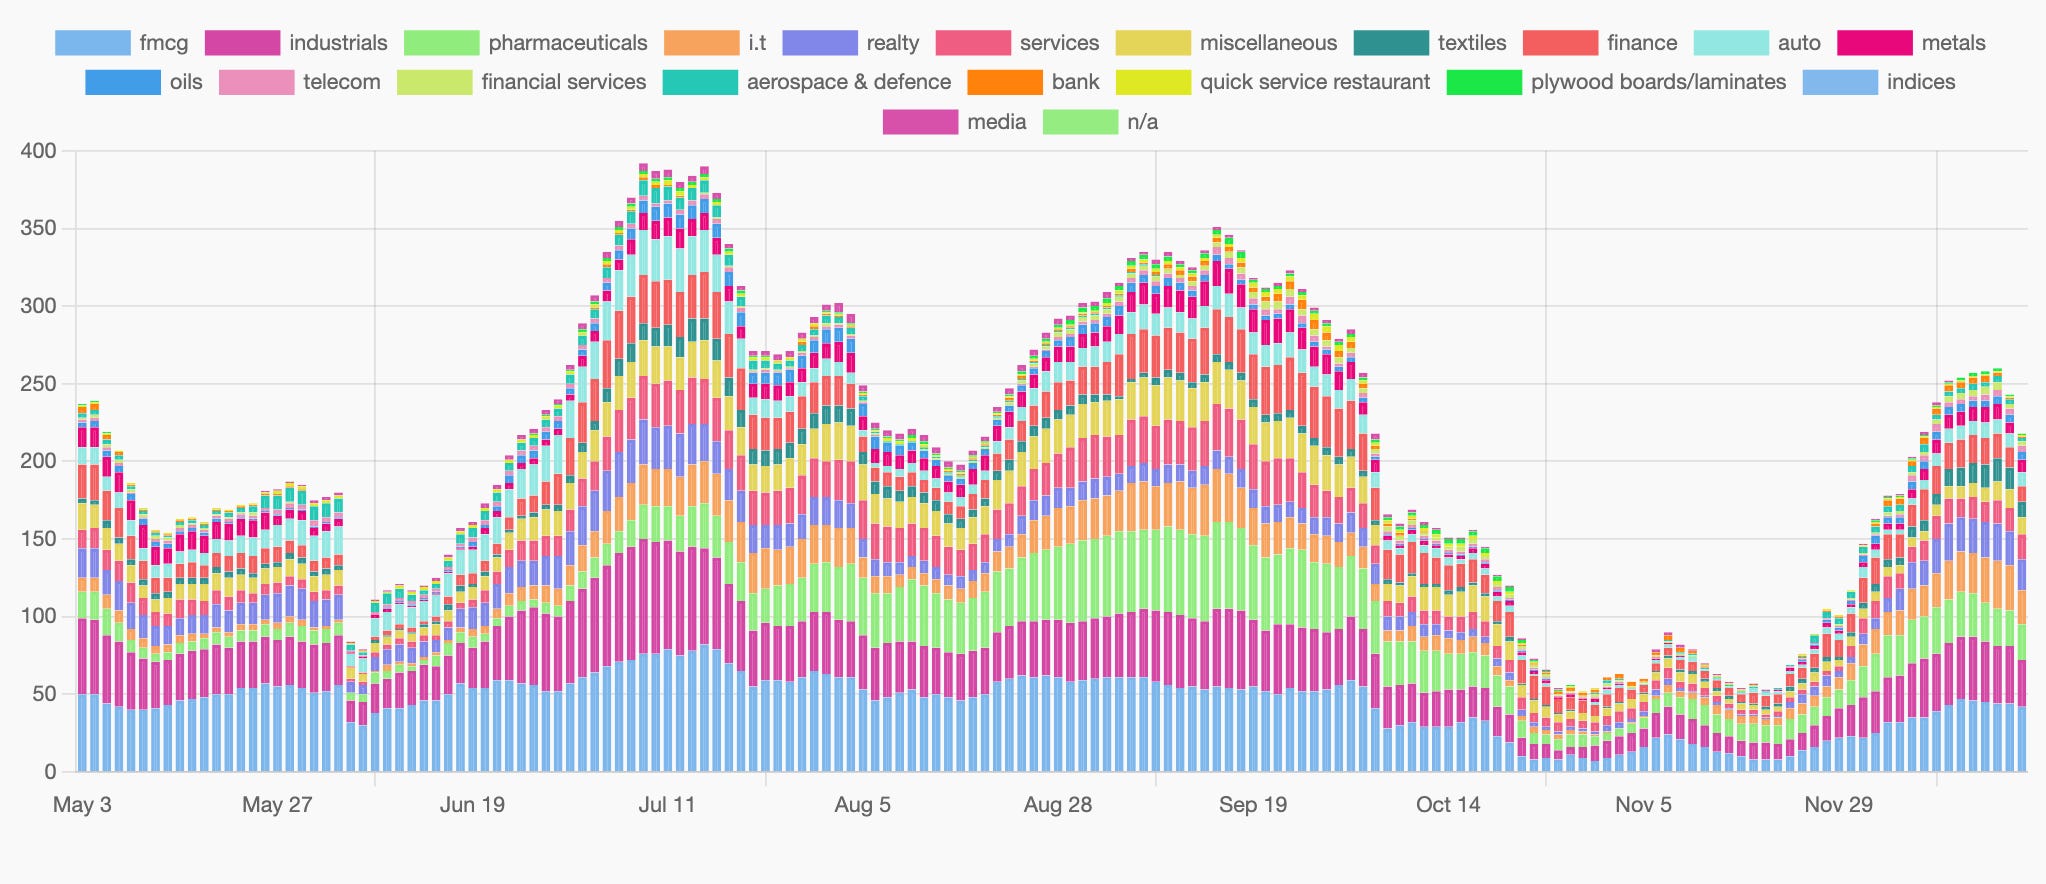
Group Strength:
The strongest groups:
Index:
Nifty Health and Pharma showed strength amidst the weakness.
Groups:
EMS is the strongest of groups.
Watchlists:
Follow the Strongest Stock (the RS 100 names):
Watchlist(s) below
Keep reading with a 7-day free trial
Subscribe to The Technical Take to keep reading this post and get 7 days of free access to the full post archives.