Market MATH & Watchlist: 12-Jan-2025
Bias: Oversold bounce in the short term but a breakdown in the medium-long term.
MATH: Momentum Anticipation and Trend by Homma:
MATH last week: Click the link
The most comprehensive article on Breadth and Anticipation:
As technical traders, We
“Anticipate, but confirm. Wish, but only react.”
Trend:
Short-term: “Percentage of stocks above 10-DMA”
Medium-term: “Percentage of stocks above 50-DMA”
Long-term: “Percentage of stocks above 200-DMA”
Short-term we are bearish and back into the oversold zone.
Medium and Longterm firmly Bearish.
Momentum: Homma Mswing Score
The Mswing score and Landry Score are both trending down again.
Landry:
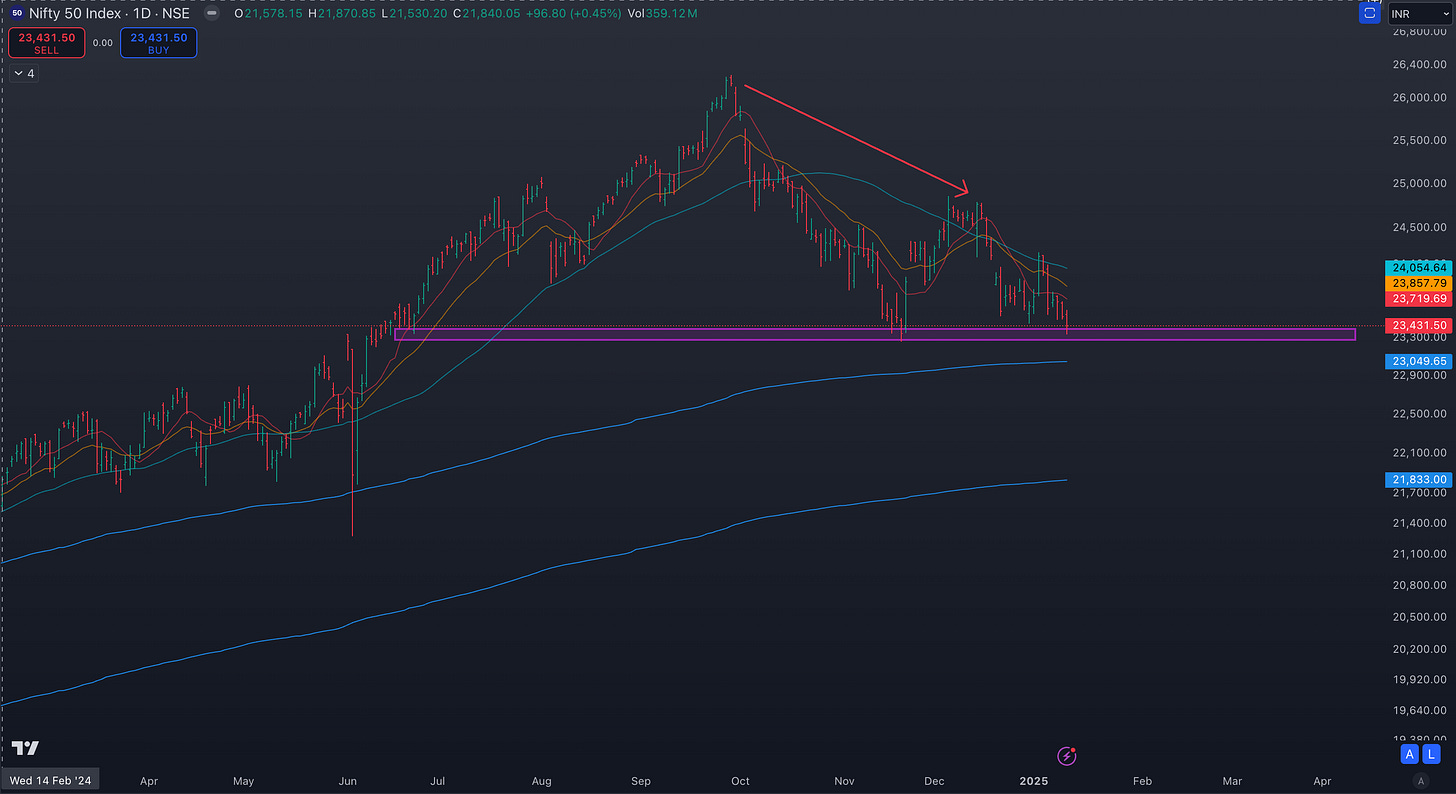
N50:
After breaking out of a small consolidation, the index failed to follow through and was slapped by the key MAs.
Now comfortably below all key MAs.
At a key level that saw a bounce previously.
The overall structure is bearish.
N500:
Same as N50.
Net4% Movers:
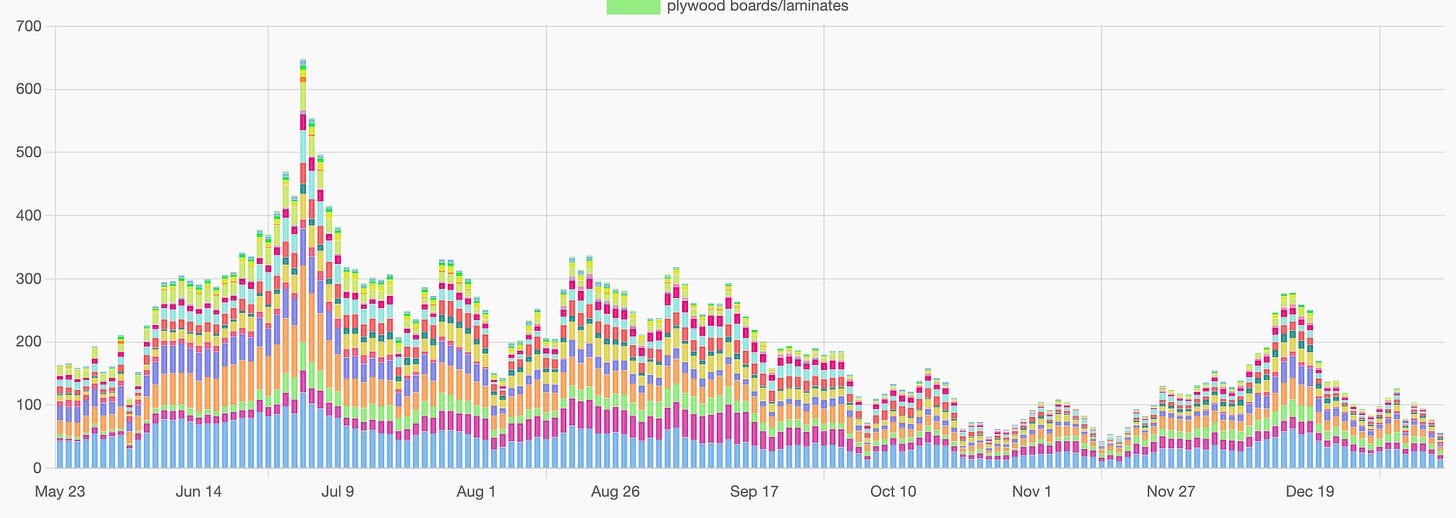
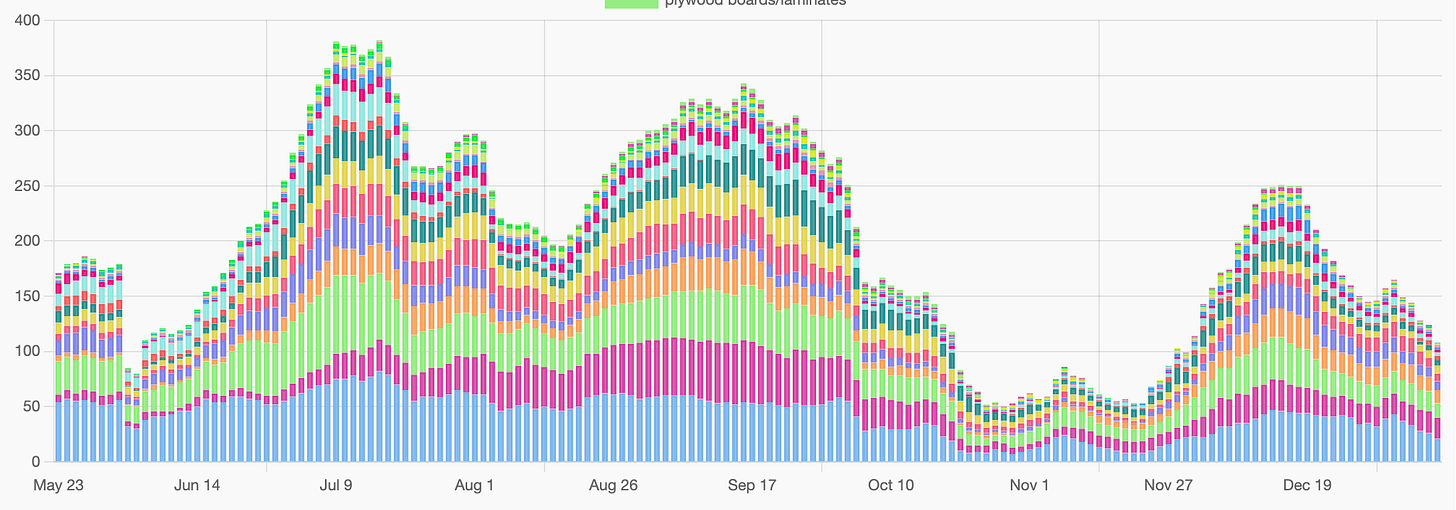
The Net4% plot remained extremely bearish last week except on 7th Jan (on failed breakout).
Anticipation:
The Midsmall400 index had an extremely bearish week and is now below all key MAs.
The overall structure looks bearish which has the shape of a H&S base. It currently sits at the neckline/support.
Short-term we can anticipate a meek bounce as we are oversold (and at a support level) but in the medium-long term, I am leaning towards the breakdown of the base.
PS: Anticipations are often wrong and bias should be adjusted with every candle.
Group Strength:
The strongest groups:
Index:
Nifty IT had a bullish week.
Groups: NA
Watchlists:
Currently, the Market Status is NO MONEY. If you are still trading,
Follow the Strongest Stock (the RS 100 names):
Watchlist(s) below
Keep reading with a 7-day free trial
Subscribe to The Technical Take to keep reading this post and get 7 days of free access to the full post archives.


