RELATIVE STRENGTH: Picking right where we left, in this article, we will look at how to identify the leaders within a strong sector.
It is a basic 2 step process:
Find the sector(s) that is outperforming the general market (Nifty 500 or N500 from hereon)
Find stocks from that sector that are outperforming N500 the most.
Simple Right?
Let’s break down the 2 steps below.
How to find the sector(s) that is outperforming the general market (N500)?
Scan the key sectoral indices manually to determine the sector which is outperforming or beginning to outperform N500, and/or
Scan the market for stocks displaying:
Highest Volumes in a year (HVY) within the last week and/or
Highest weekly volumes in the last 52 week.
Highest weekly closing in the last 52 weeks.
(I use a freely available software called chartink for running my scans. I have linked these scanners at the end of the article.)
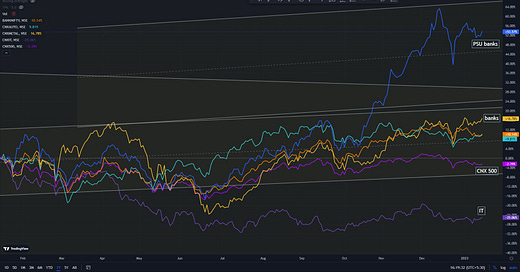
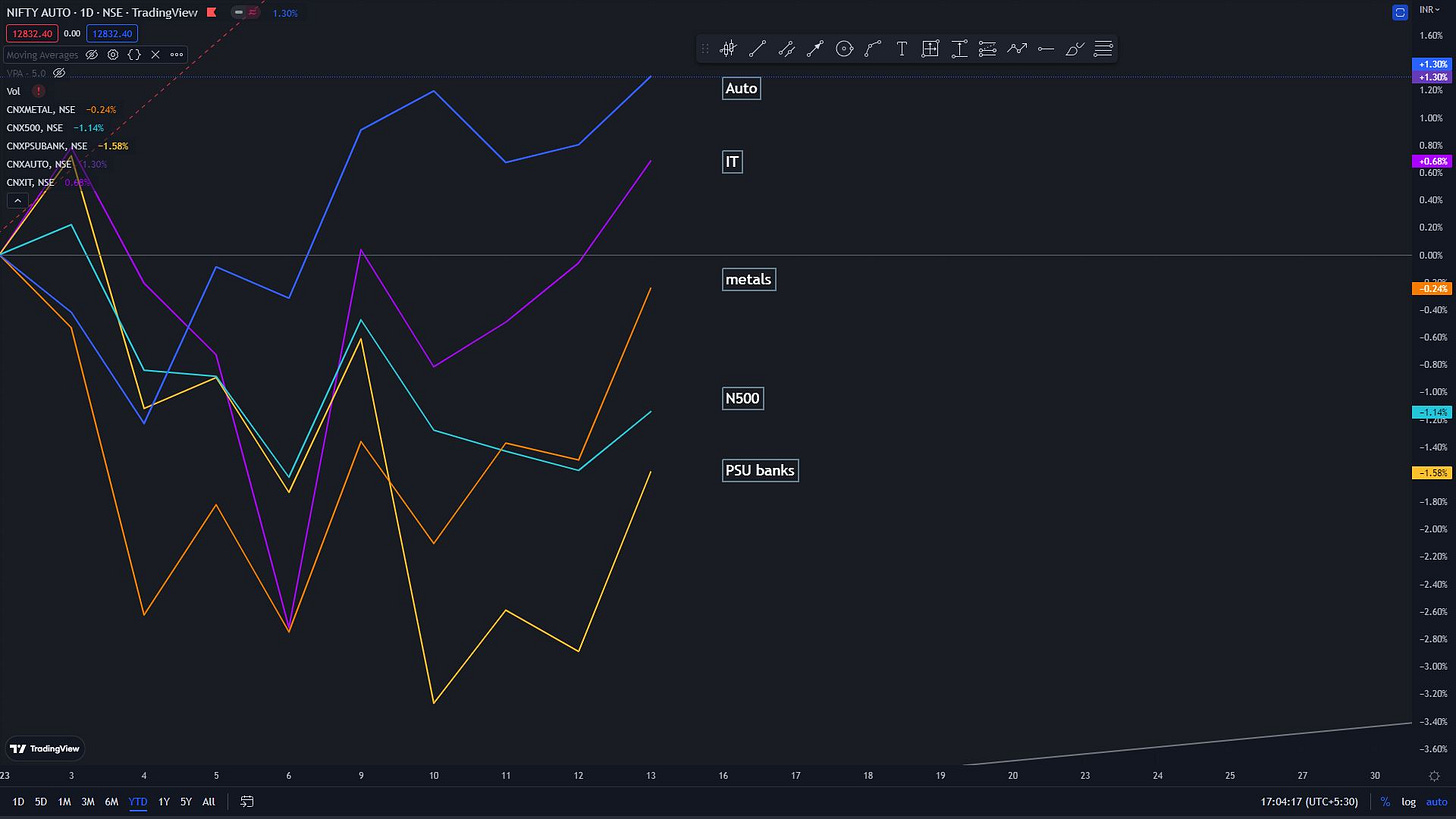
Lets take an example, after manually going through each indices, banks still looks strong and particularly PSU banks (chart 1), whereas if you compare the YTD (year to date) performace Auto, IT and Metals looking for resurgence (chart 2).
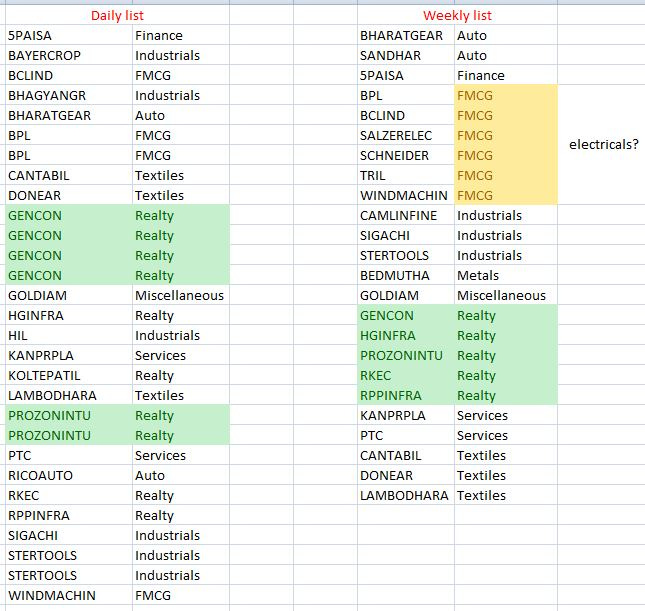
Now looking at the latest HVY scans below, what do we see?
Some Auto names as confirmed by index charts.
Additionally some Realty, Electricals and Textile names.
This is important as these themes may just be starting to gain relative strength and is not visible on the charts yet.
A caution to be maintained while using the HVY scans is to look at the price. Only those names where there is price expansion are the ones showing strength. Those which are decreasing in price with high volumes are most likely in a downtrend or starting thier downtrend journey.
Additionally, looking at the 52 week high closing names will inform us even more about the strongest names in the market. A stock with strength is more likely to make a 52 week high than a stock that has no/less strength (more on this scan in later articles).
Moving forward, we will use Auto sector as an example to find the Auto names which are separating themselves from the Auto pack. To conclude, it looks like PSU banks are still holding well. Autos/auto ancilliaries, textiles and Infra/reality names are making some noise and may be on their way up or plotting a reversal.
How to find the leaders in the Auto sector?
We will start by looking at the Index and then move to look at individual Auto names.
Observations:
The RS line is crossing back above 0 and its moving average, both of which are bullish signals.
Auto is already in a bullish ascending channel (AC).
Corrected recently to the AC midline and now is looking to resume the uptrend (this can be anticipated based on RS and the HVY names).
So far the index looks very positive. Now let us look at the individual Auto names to see if our index level observation is in congruence with the individual stocks data.
For this, you will obviously need a watchlist of Auto stocks first (link to my trading view watchlist https://in.tradingview.com/watchlists/92627884/ )
Now let’s look at the individual names one by one on a weekly timeframe. We are looking for the following:
Price breaking out (or about to) of some form of consolidation/base or, bouncing back from a pullback, and/or
Relative strength line turning up or moving higher (like that on the index)
After this exercise, you will basically narrow down the auto names to less than 10 out of the 100 odd names. Your winners will be from these 10 names only.
The next step would be to block the noise and track these names for a surgical entry in the next few days/weeks.
We will talk about this step in more detail in our next articles.
To know my top picks from Auto sector, please follow me on twitter. I will be tweeting the list in there soon. Maybe write a weekend thread as well.
Also, checkout my Youtube channel for weekly video update about the general markets.
That is all for this week.
Happy Makar Sankranti, Bihu, Pongal to all of you.
Have a great weekend.
&
I will see you soon.
Cheers


Hello readers. Here is the link to the two scanners
1. HVY: https://chartink.com/screener/sakatas-highest-volumes-in-a-year
2. 52 week high close:
https://chartink.com/screener/sakatas-52-week-high-close
Apologies for the delay.
Thank you prakash bhai for this informative article.Could you please say which period of moving avg you are generally settings up in Mansfield relative strength indicator both in daily and weekly chart