

MATH: Momentum Anticipation and Trend by Homma:
MATH last week: Click the link
As technical traders, we
“Anticipate, but confirm. Wish, but only react.”
"Skate to where the puck is going to be, not where it has been." ~ Wayne Gretzky
By anticipate, I do not mean “make positions earlier”. What I mean is, assign probabilities to all possible scenarios of what could happen next. Stack those probabilities when those scenarios unfold. And change (increase/decrease) your risk exposure according to changing (increasing/decreasing) Market breadth.
And be mentally prepared with the (your) response. It is a mental exercise. It helps you act faster when the confirmation eventually comes in.
Lastly, be okay with any result/possibility that comes next.
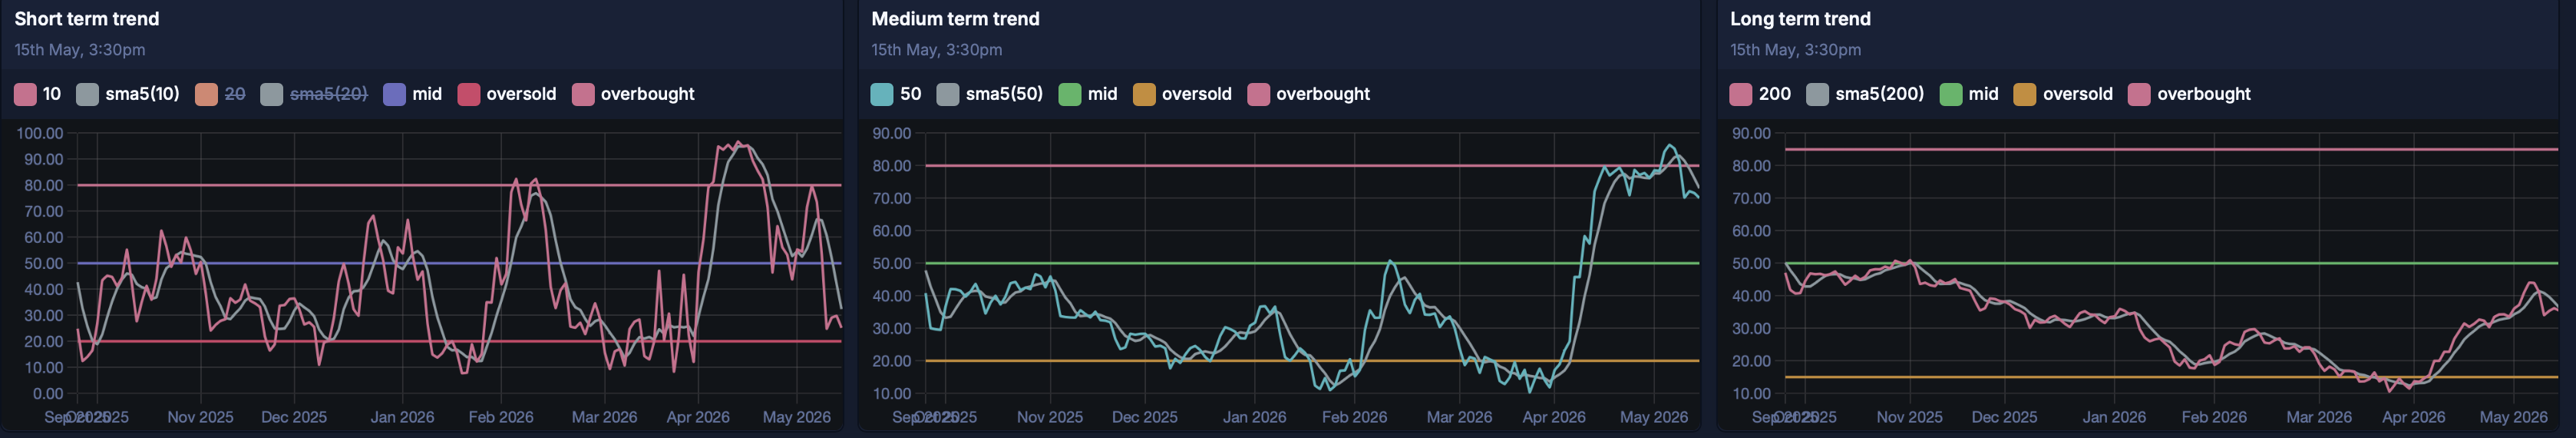
Short-term: “Percentage of stocks above 10/20-DMA”
Medium-term: “Percentage of stocks above 50-DMA”
Long-term: “Percentage of stocks above 200-DMA”
In the short term, bearish and declining.
In the medium term, bullish but declining.
In the medium term, bearish and declining.
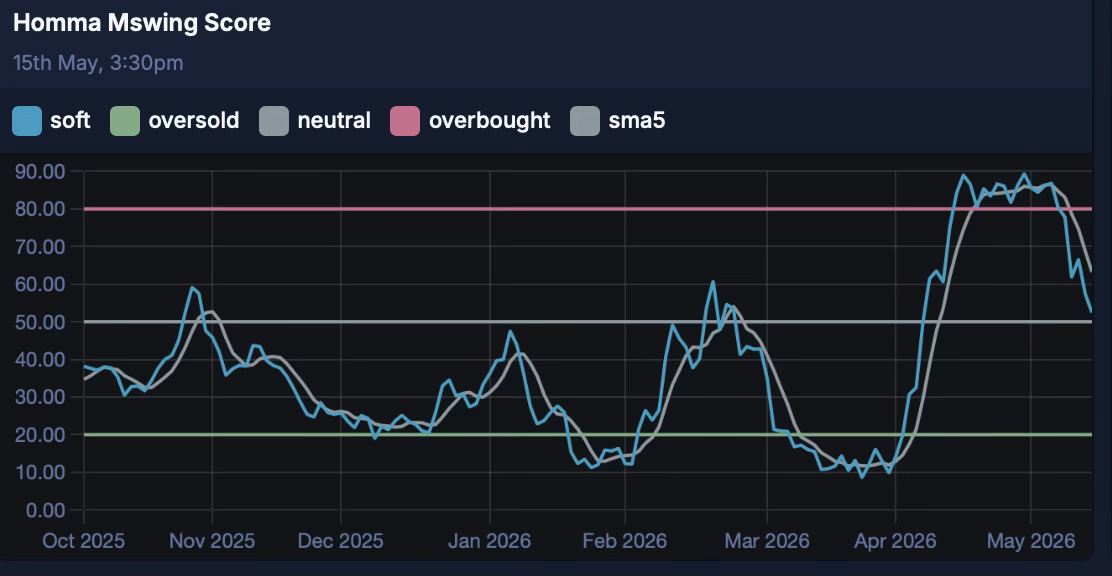
Momentum: Declining
Homma Mswing Score: (basal Momentum)
Bullish but declining.
Landry Daily: (Hard Momentum. Momentum Bias for Swing Play)
(Landry Momentum plot is lagging in nature).
Declining
Landry Weekly (Momentum Bias for Positional Play):
(Landry Momentum plot is lagging in nature).
Bullish momentum stalls
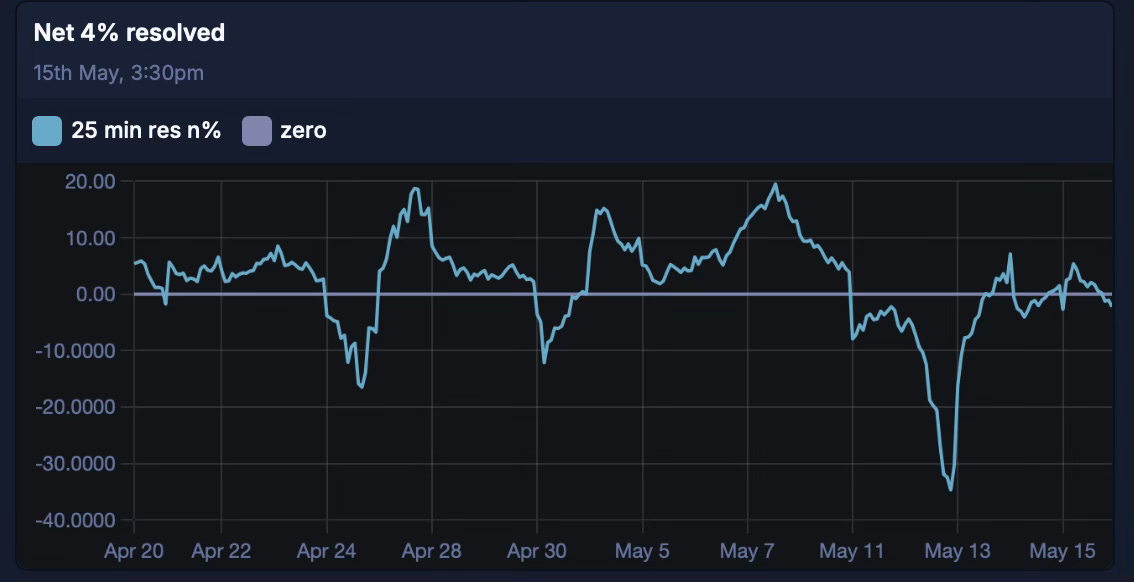
Net4% Movers:
Sideways to bearish.
N50:
The structure in higher timeframe is bearish.
As opposed to the bullish anticipation, the small base broke down below all key MAs.
Bias is now bearish until it breaks out of the base.
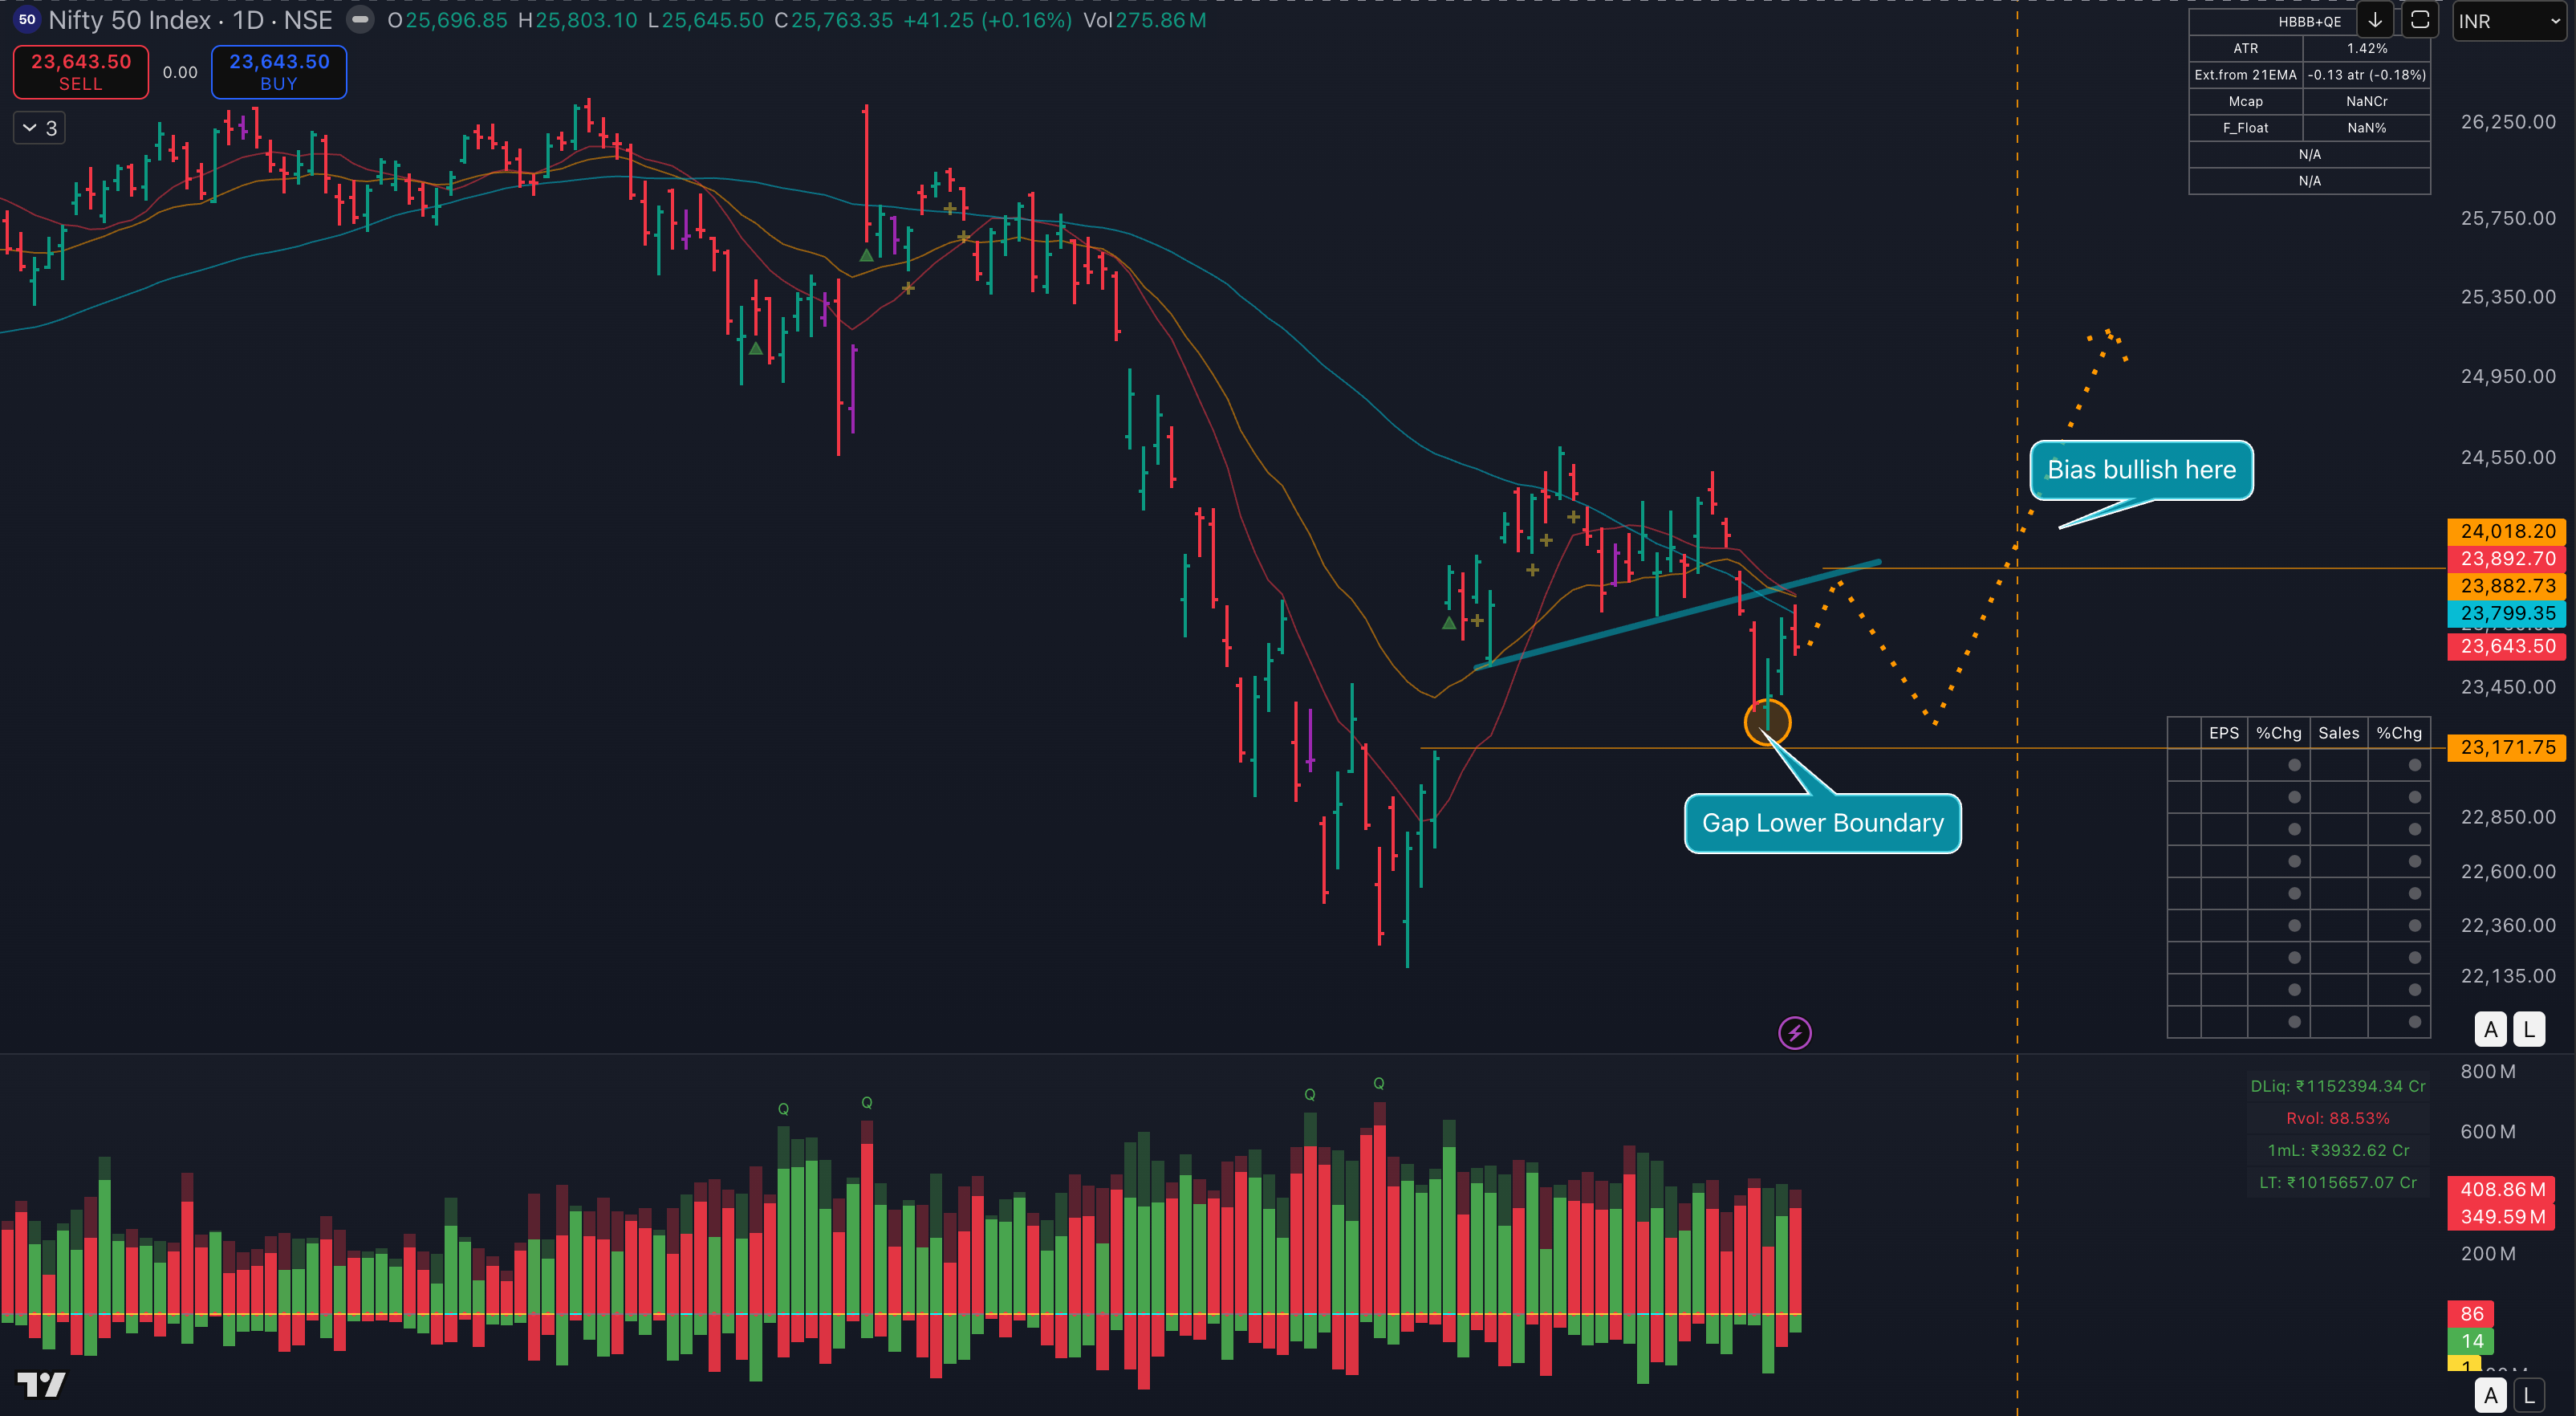
.
Anticipation:
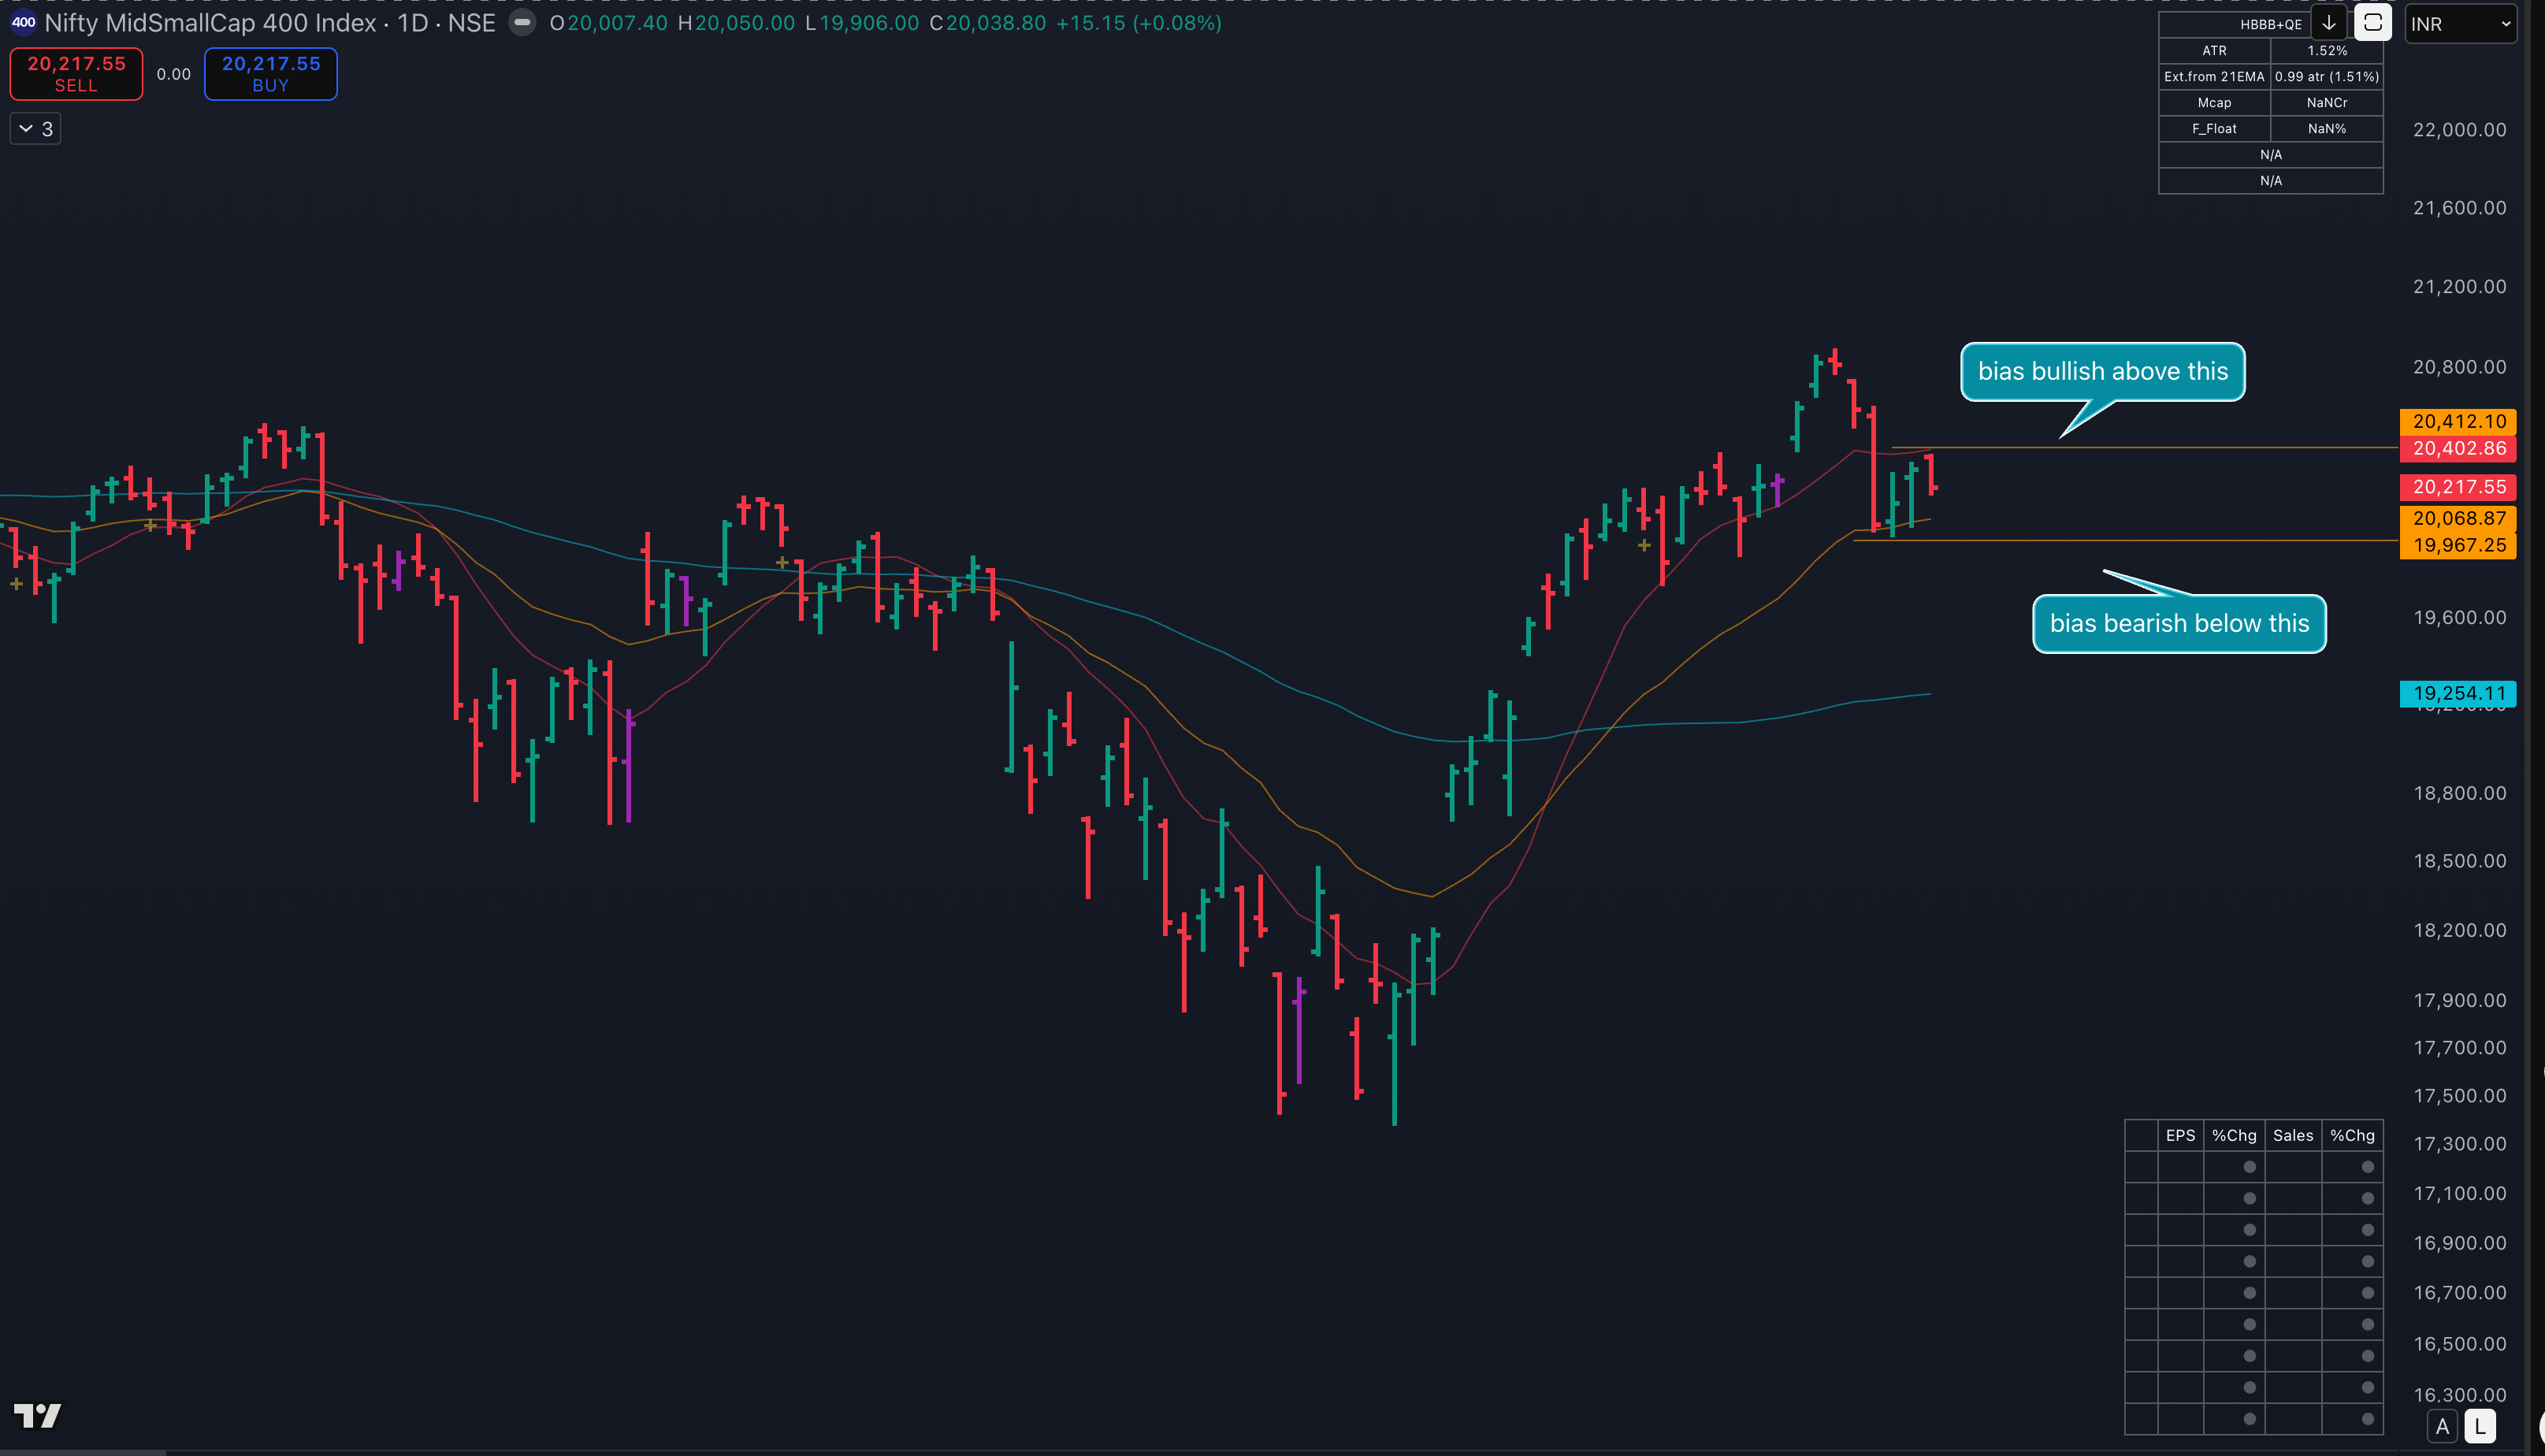
Midsmall400
Is still on an uptrend.
As anticipated, the pullback is here to the 21ema.
Currently basing just above the 21ema.
I have a neutral bias as to whether it bounces or tests the 50-DMA.
If USDINR keeps rising and rupee continue to be bearish and Oil breaks out of the continuation base, 50-DMA test would be inevitable.
Positional bias = Hard money
Swing = Hard-No Money. Therefore, swing portfolio should be light.
PS: Anticipations are often wrong, and biases should be adjusted after every candle.
A quirky Bull Market indicator:
One that tells you for sure when a bull market is in.
One that eases your anxiety and assures you that the market will NOT take off without you.
One that keeps you from jumping in too big, too soon.
One that keeps your expectations in check, IF you are still trading.
(link to the indicator at the bottom)
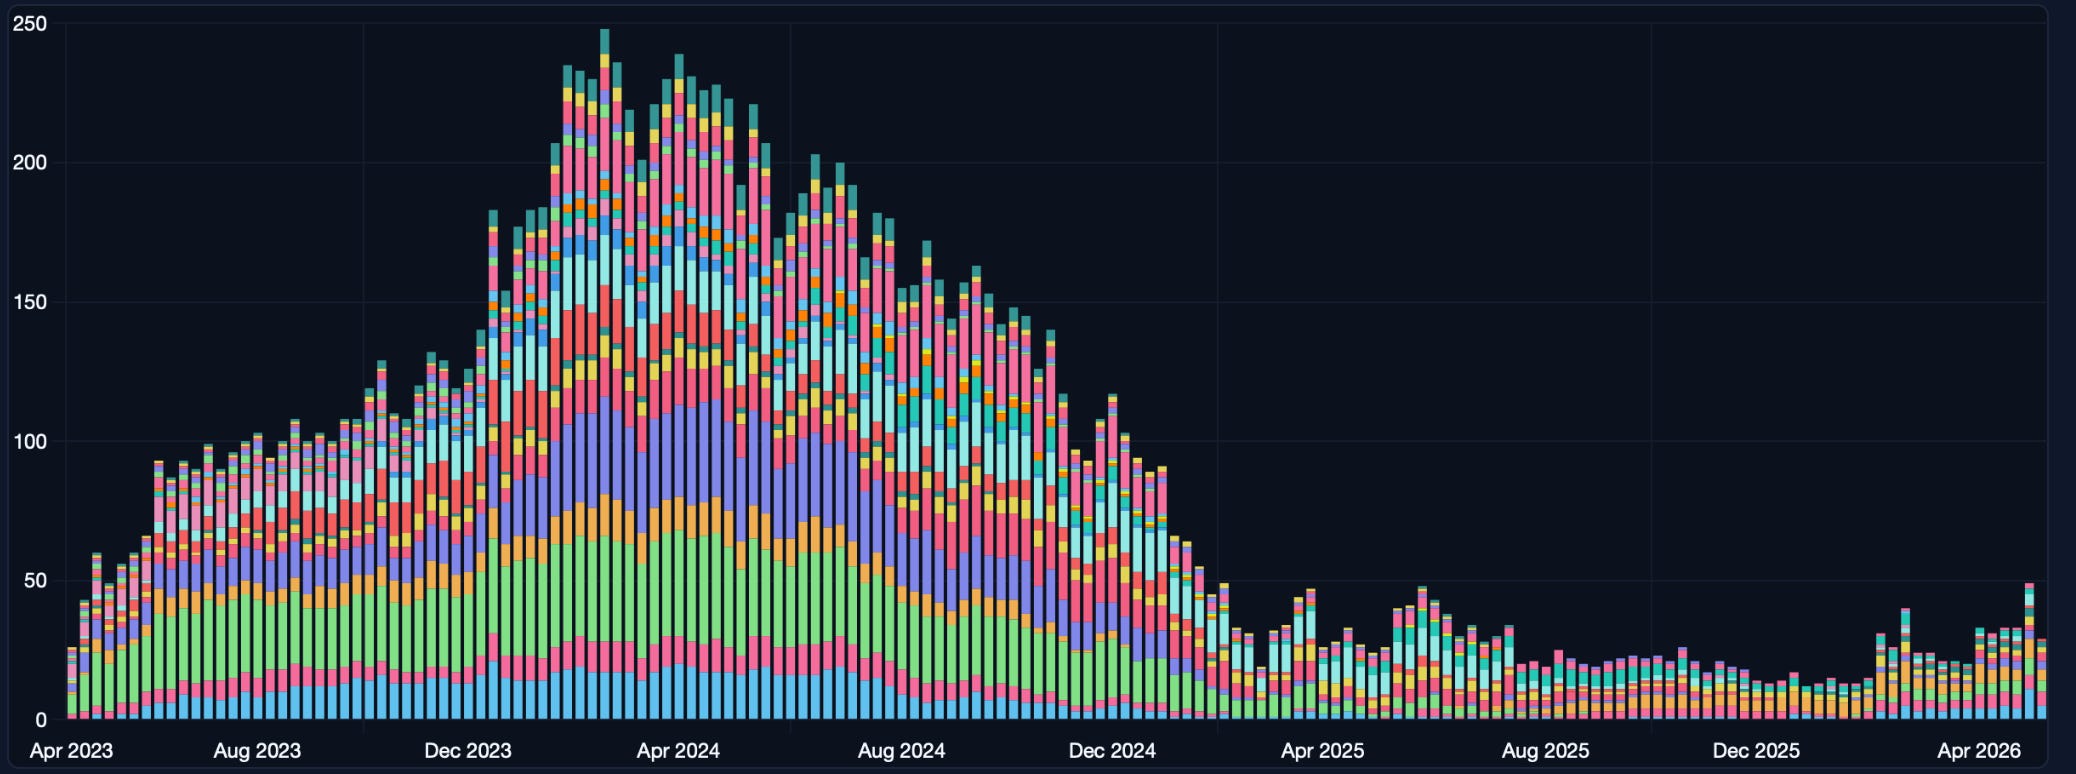
Observation: Bullishness fizzles out this week. Still waiting for the plot to trend above 50 for 3 weeks.
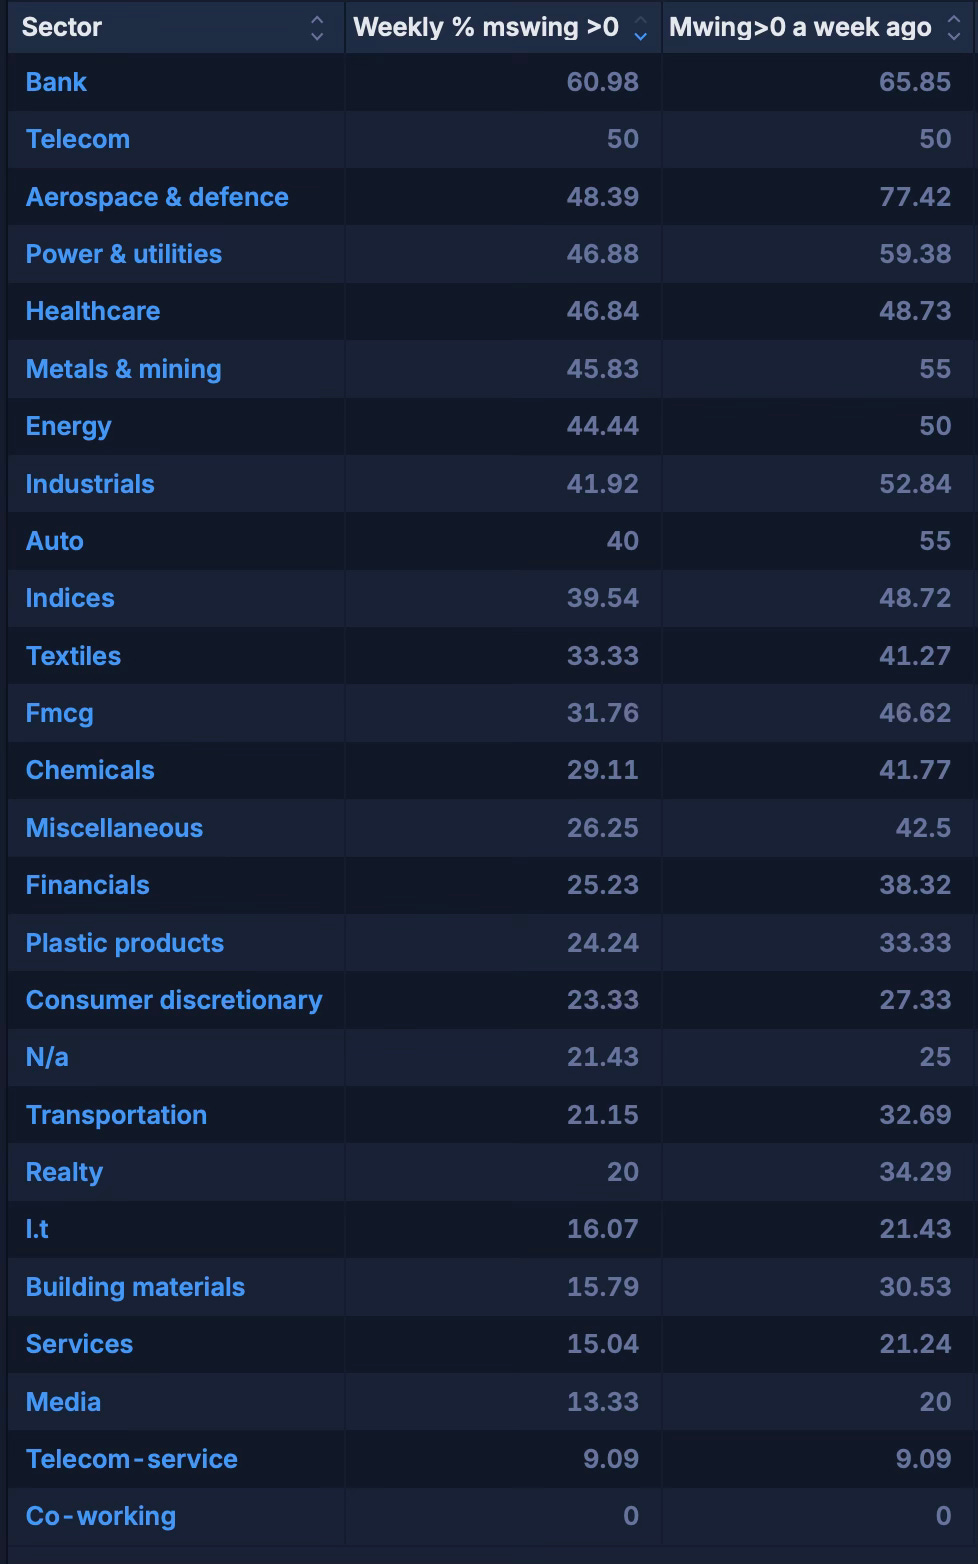
Group Strength:
A weekly Mswing >50% and rising is bullish; <50% and falling is bearish.
Sectoral: Electro
Leading groups: Electricals-cables, Defence, Power/Energy-related, Capital Goods, Banks.
Most Bullish this Week =
Strength continuation =
Bottom Strength =
Sectors/Groups I like as LRE =
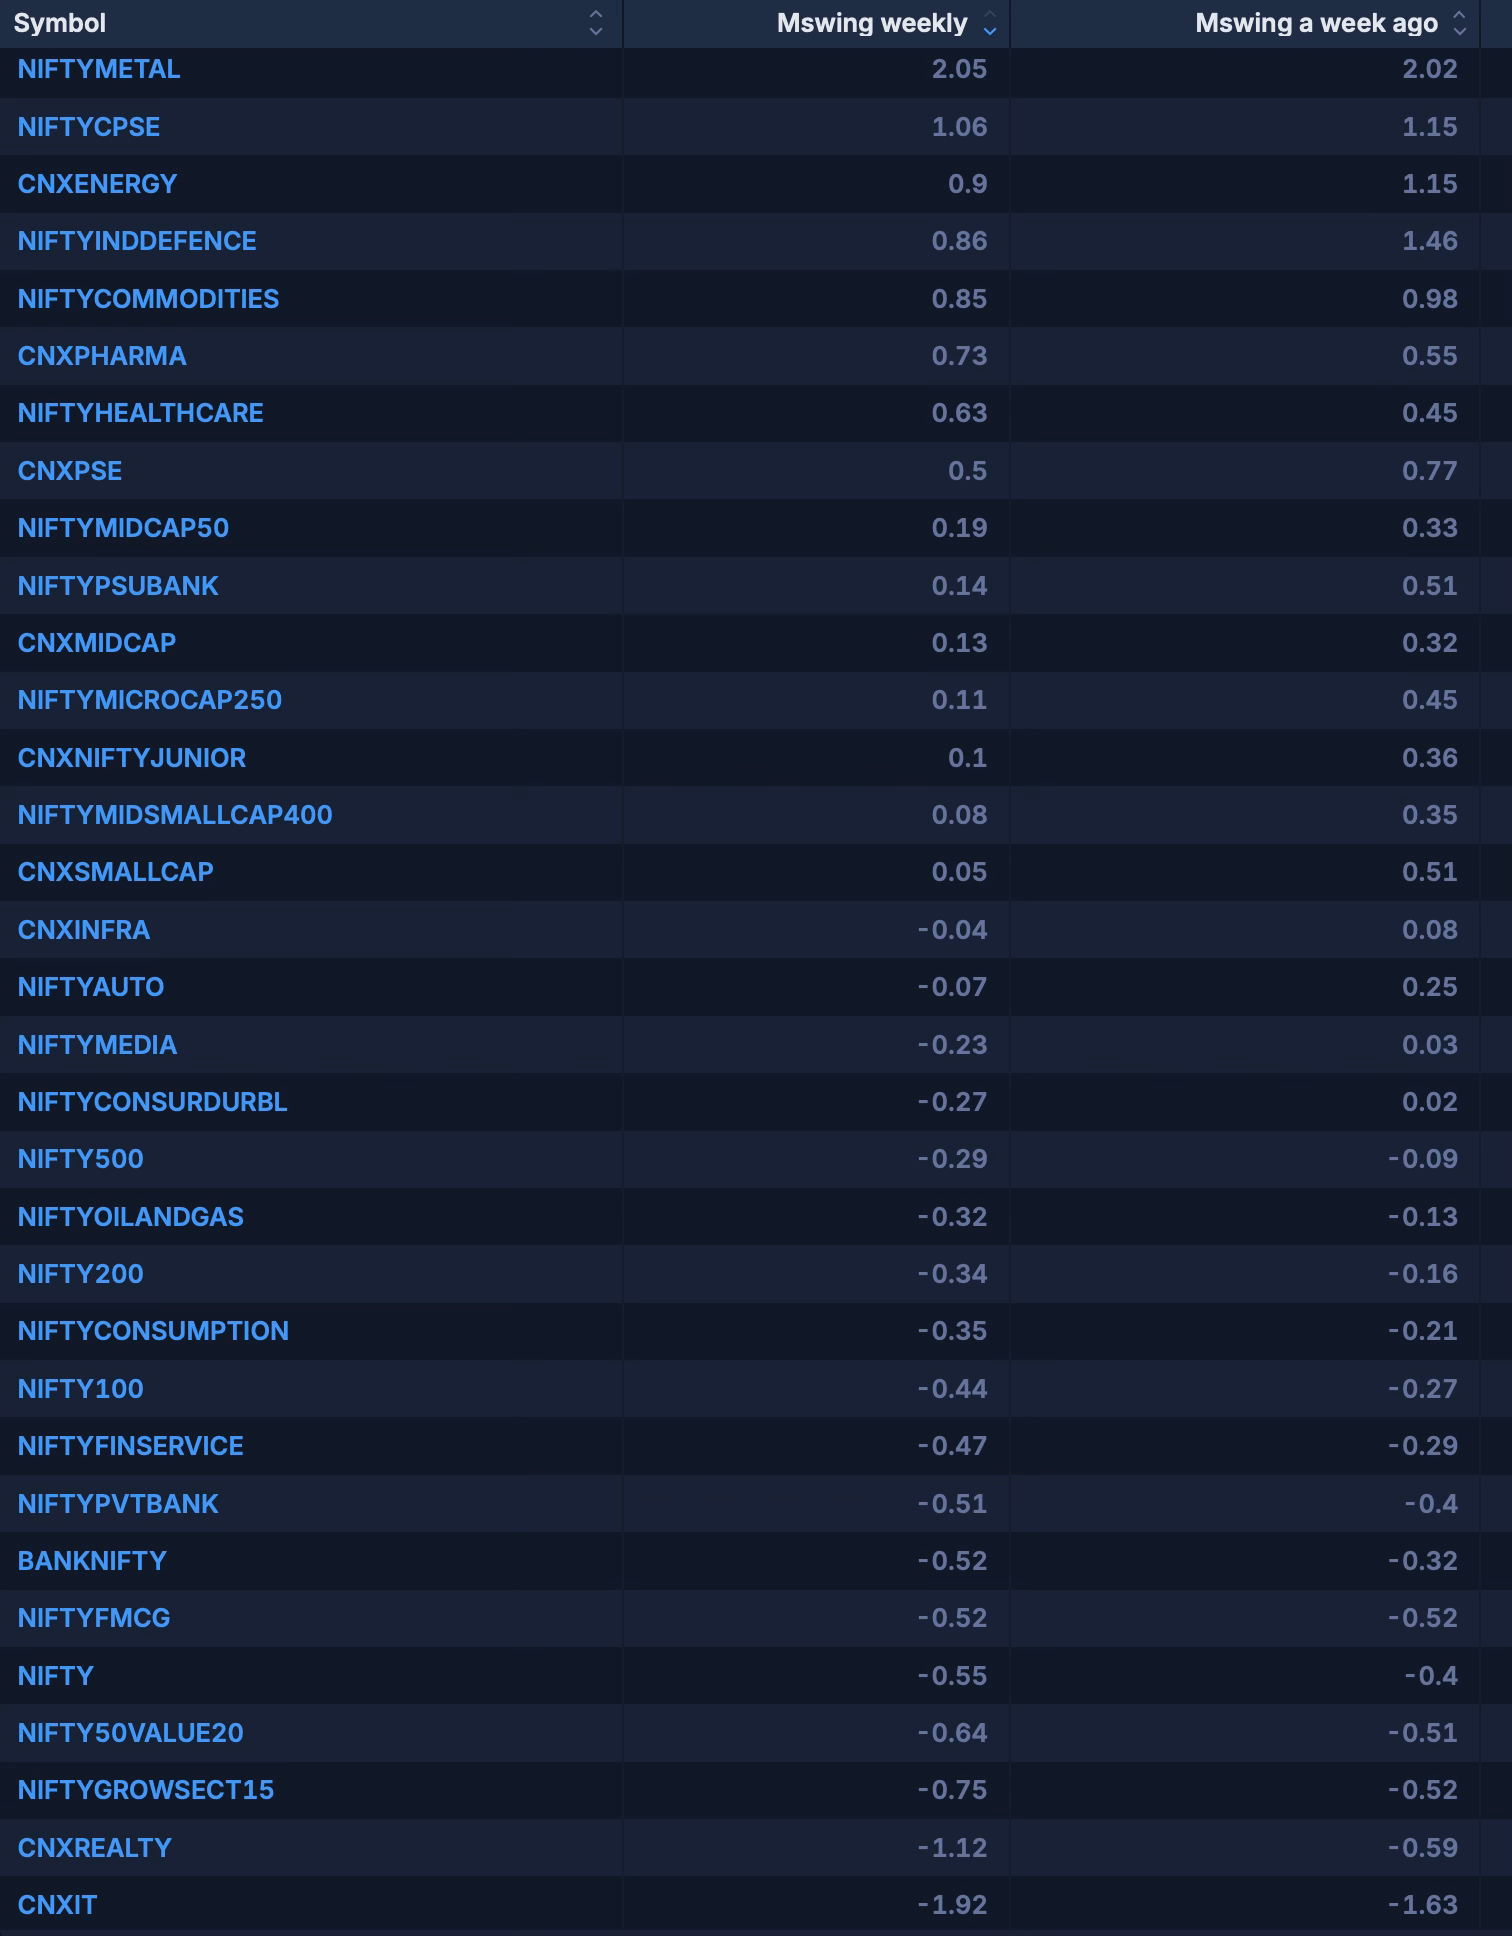
Index:
Mswing above 1% (and rising) is a positive momentum.
Leaders = Metals, Energy, Defence
Most bullish this week = Pharma, healthcare, metals
Indices I like as LREs = Defence, Capital goods, Power
.
When market regime is Hard-Easy Money, find the lowest risk entries from the leading strongest groups in my actionable watchlist for the week below.
Leaders will be in the High Momentum List- Mswing.
Current Market Regime: Hard-No MONEY
Watchlists:
Follow the Leading Stocks (the Mswing RS100 and RS100-Liquid watchlists below):
Potential leaders list
within 15% of 52-week High list
