

MATH: Momentum Anticipation and Trend by Homma:
MATH last week: Click the link
As technical traders, we
“Anticipate, but confirm. Wish, but only react.”
"Skate to where the puck is going to be, not where it has been." ~ Wayne Gretzky
By anticipate, I do not mean “make positions earlier”. What I mean is, assign probabilities to all possible scenarios of what could happen next. Stack those probabilities when those scenarios unfold. And change (increase/decrease) your risk exposure according to changing (increasing/decreasing) Market breadth.
And be mentally prepared with the(your) response. It is a mental exercise. It helps you act faster when the confirmation eventually comes in.
Lastly, be okay with any result/possibility that comes next.
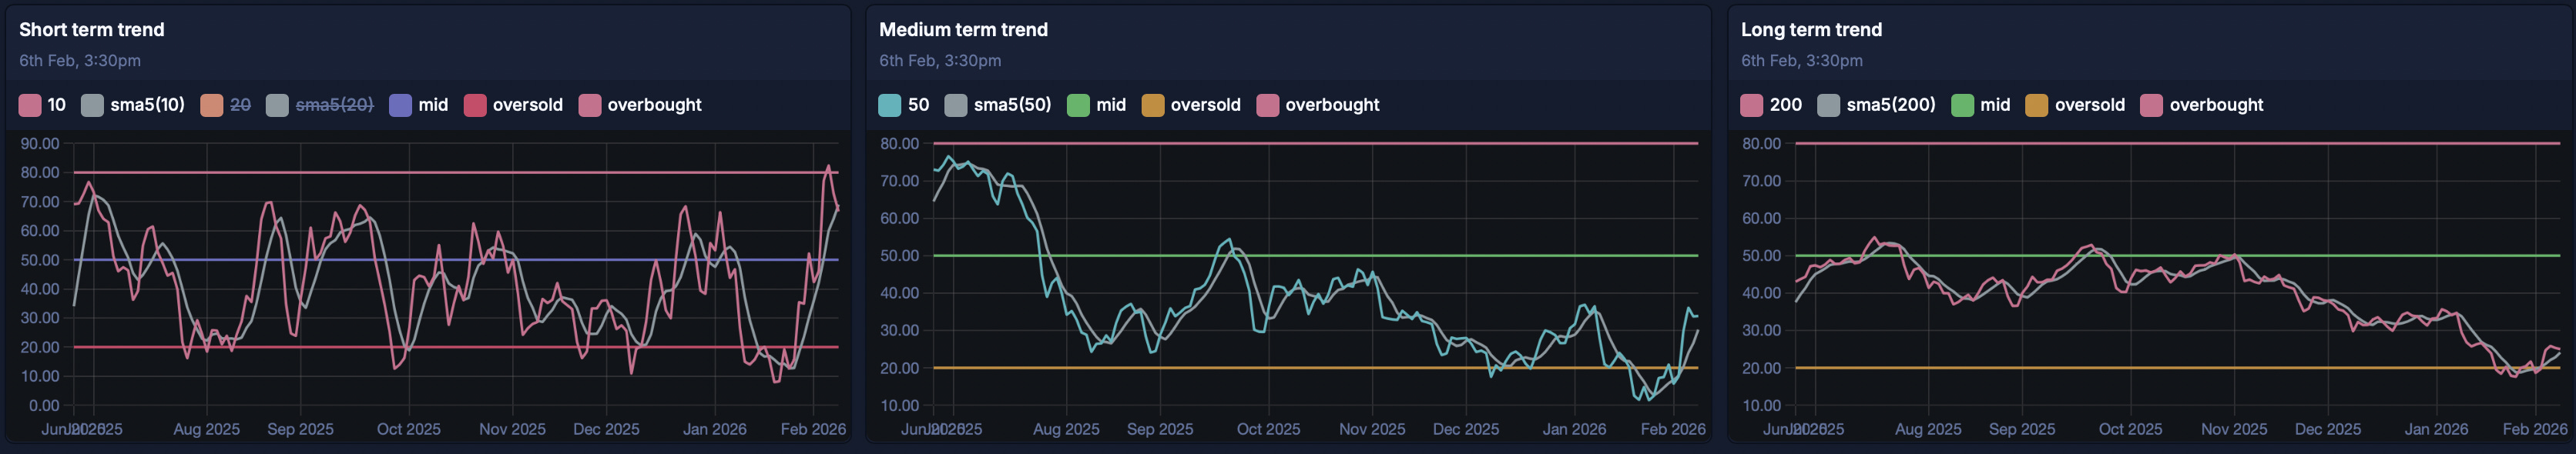
Trend: Bearish but trending up
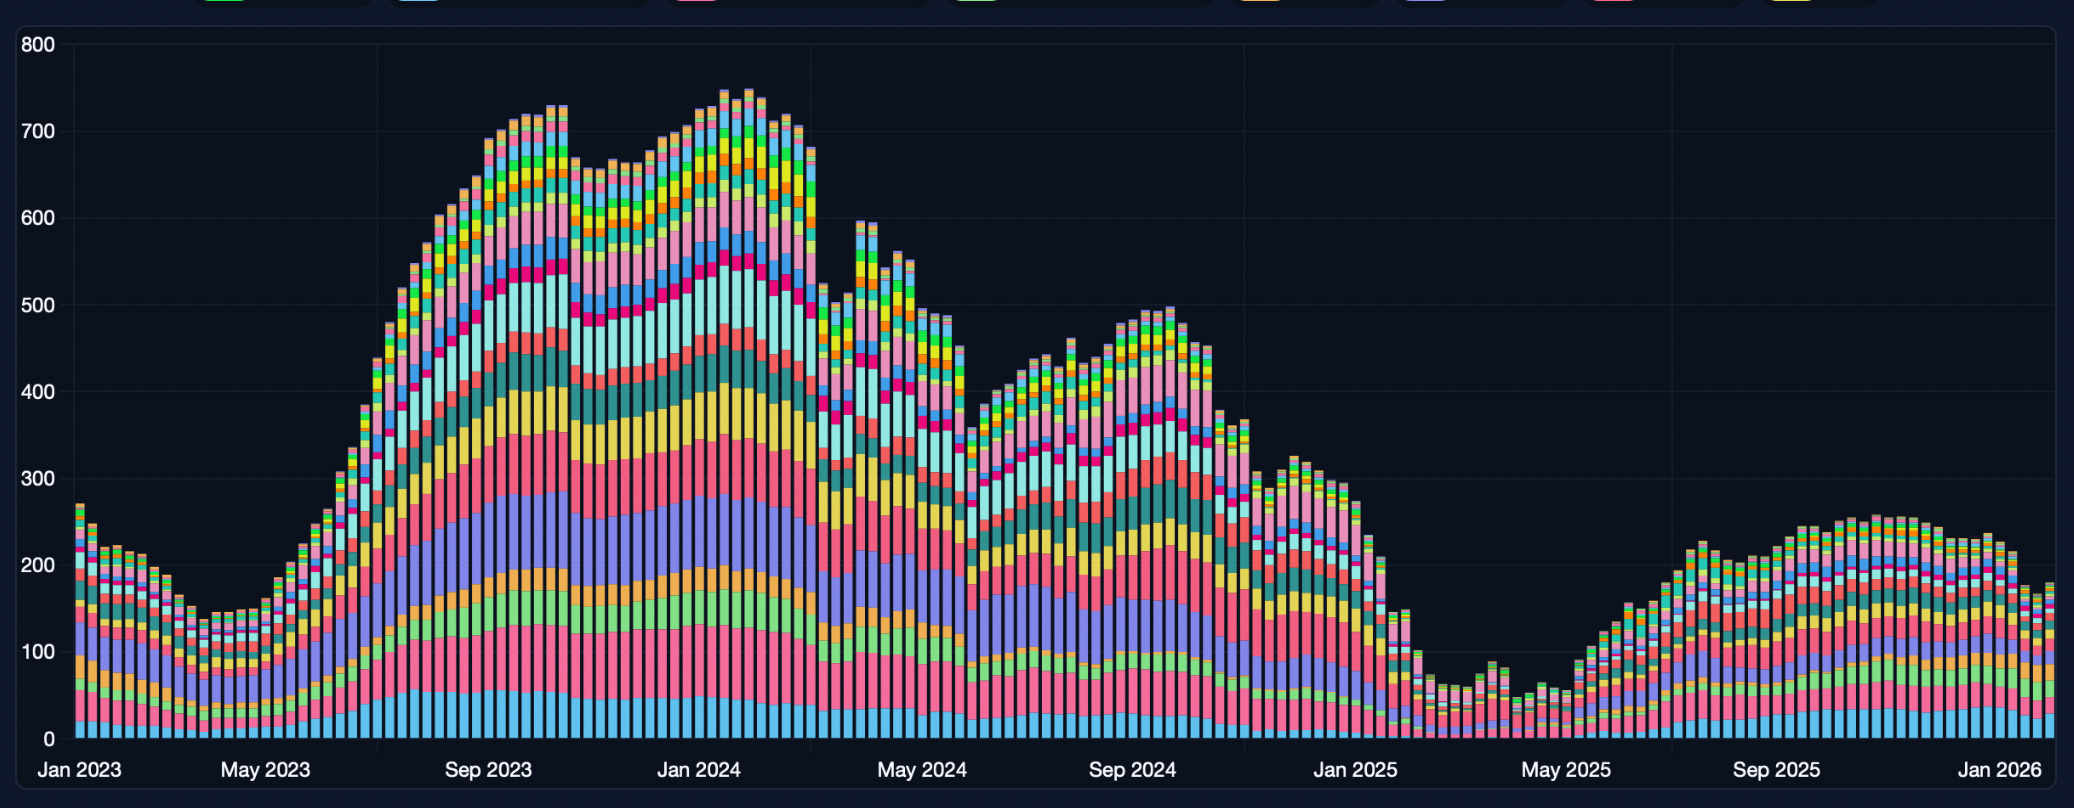
Short-term: “Percentage of stocks above 10/20-DMA”
Medium-term: “Percentage of stocks above 50-DMA”
Long-term: “Percentage of stocks above 200-DMA”
In the short term, bullish.
In the medium term, bearish but trending up.
In the long-term, bearish but trending up.
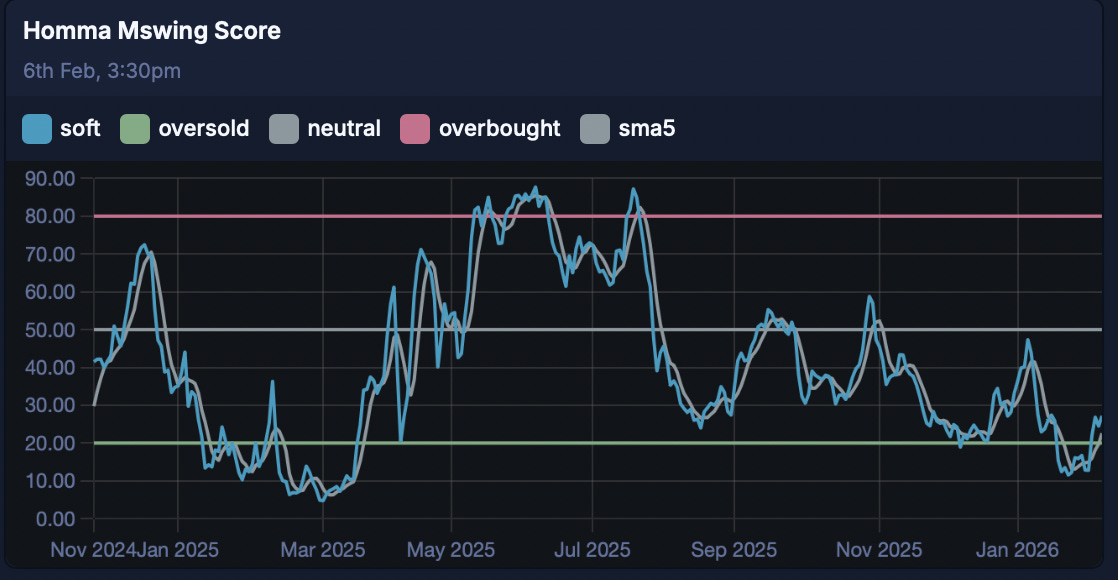
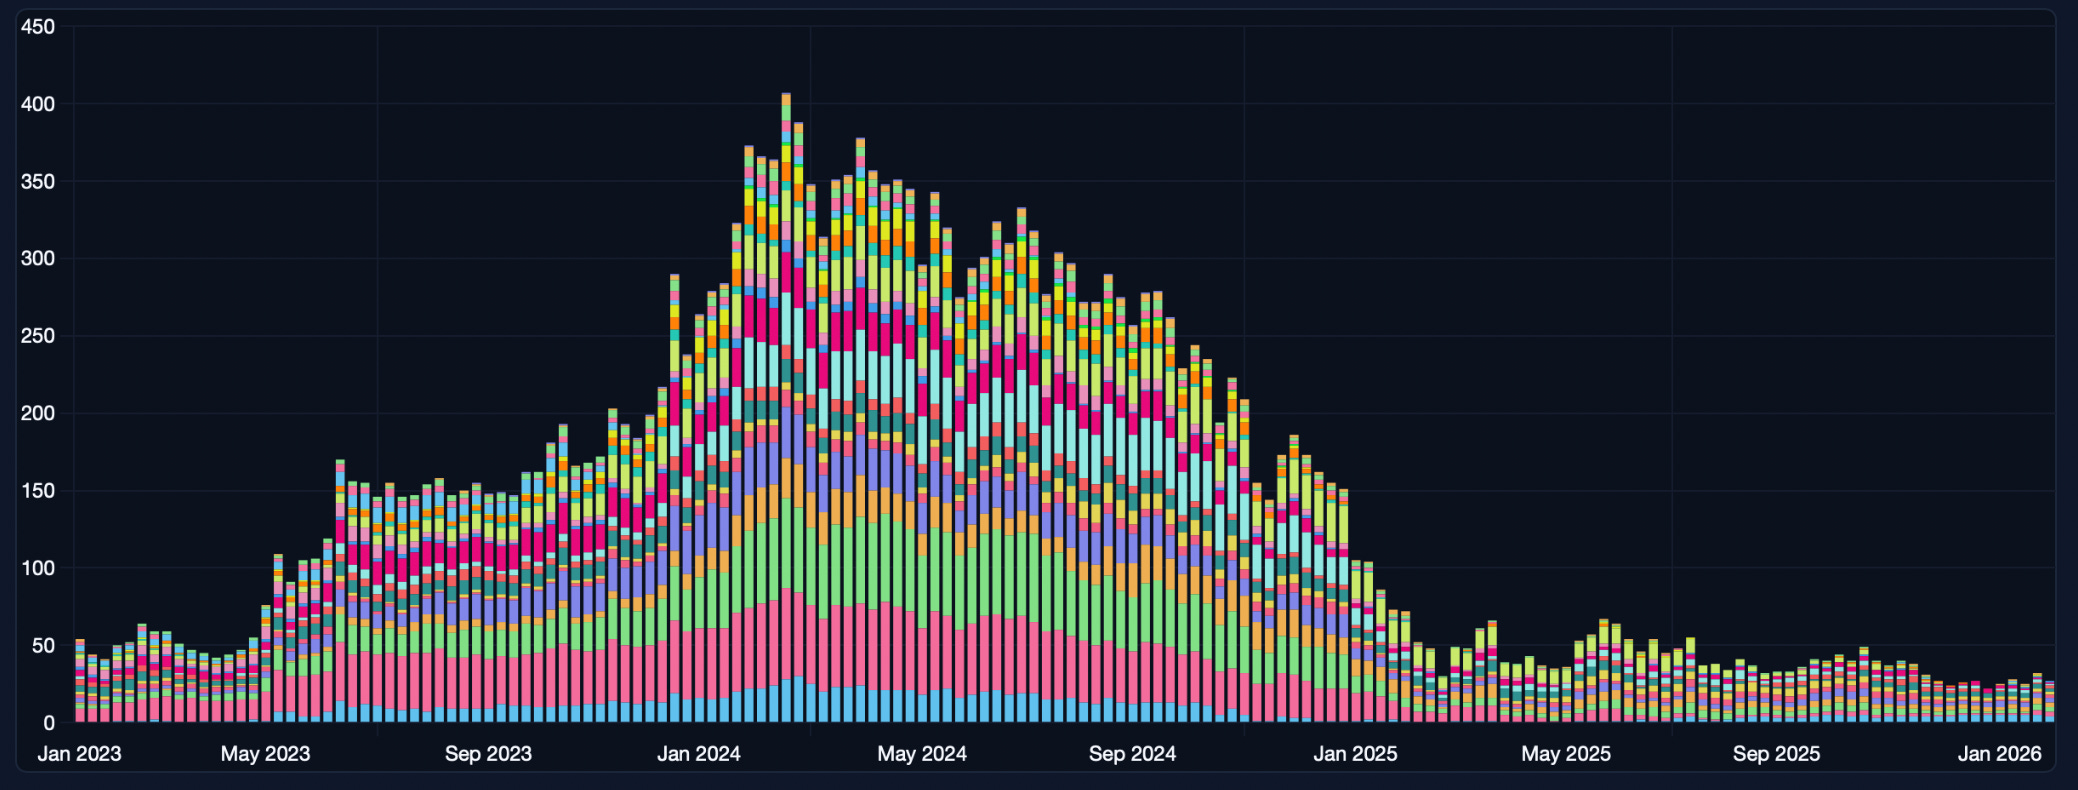
Momentum: Bearish but on an upswing
Homma Mswing Score: (basal Momentum)
Landry Daily: (Hard Momentum. Momentum Bias for Swing Play)
(Landry Momentum plot is lagging in nature).
Landry Weekly (Momentum Bias for Positional Play):
(Landry Momentum plot is lagging in nature).
Trending down but has an uptick this week
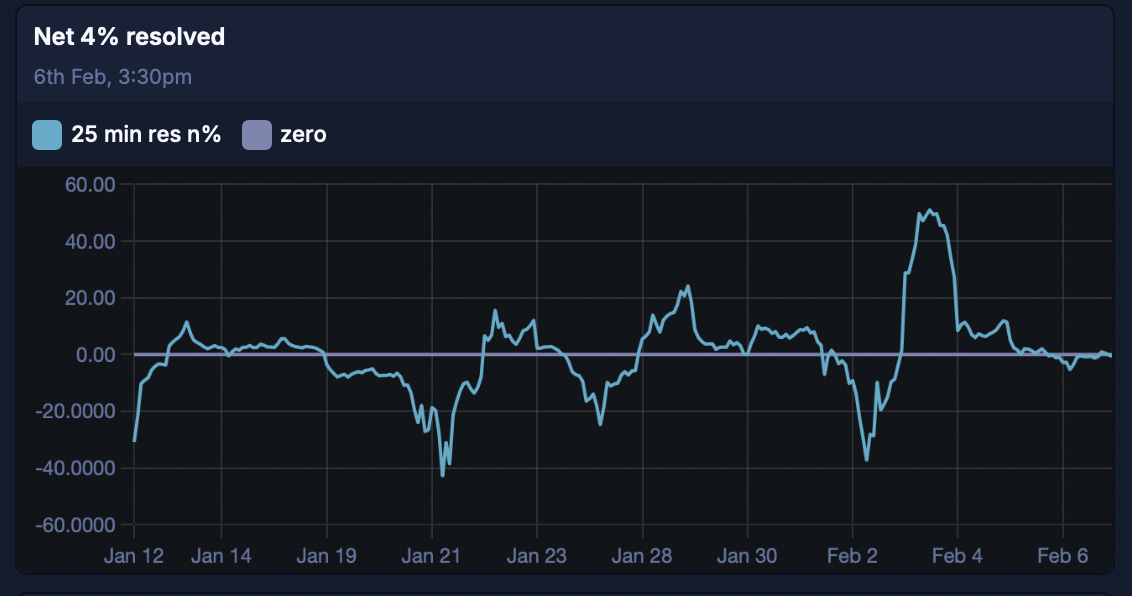
Net4% Movers:
Pulled back to zero line after the massive spike.
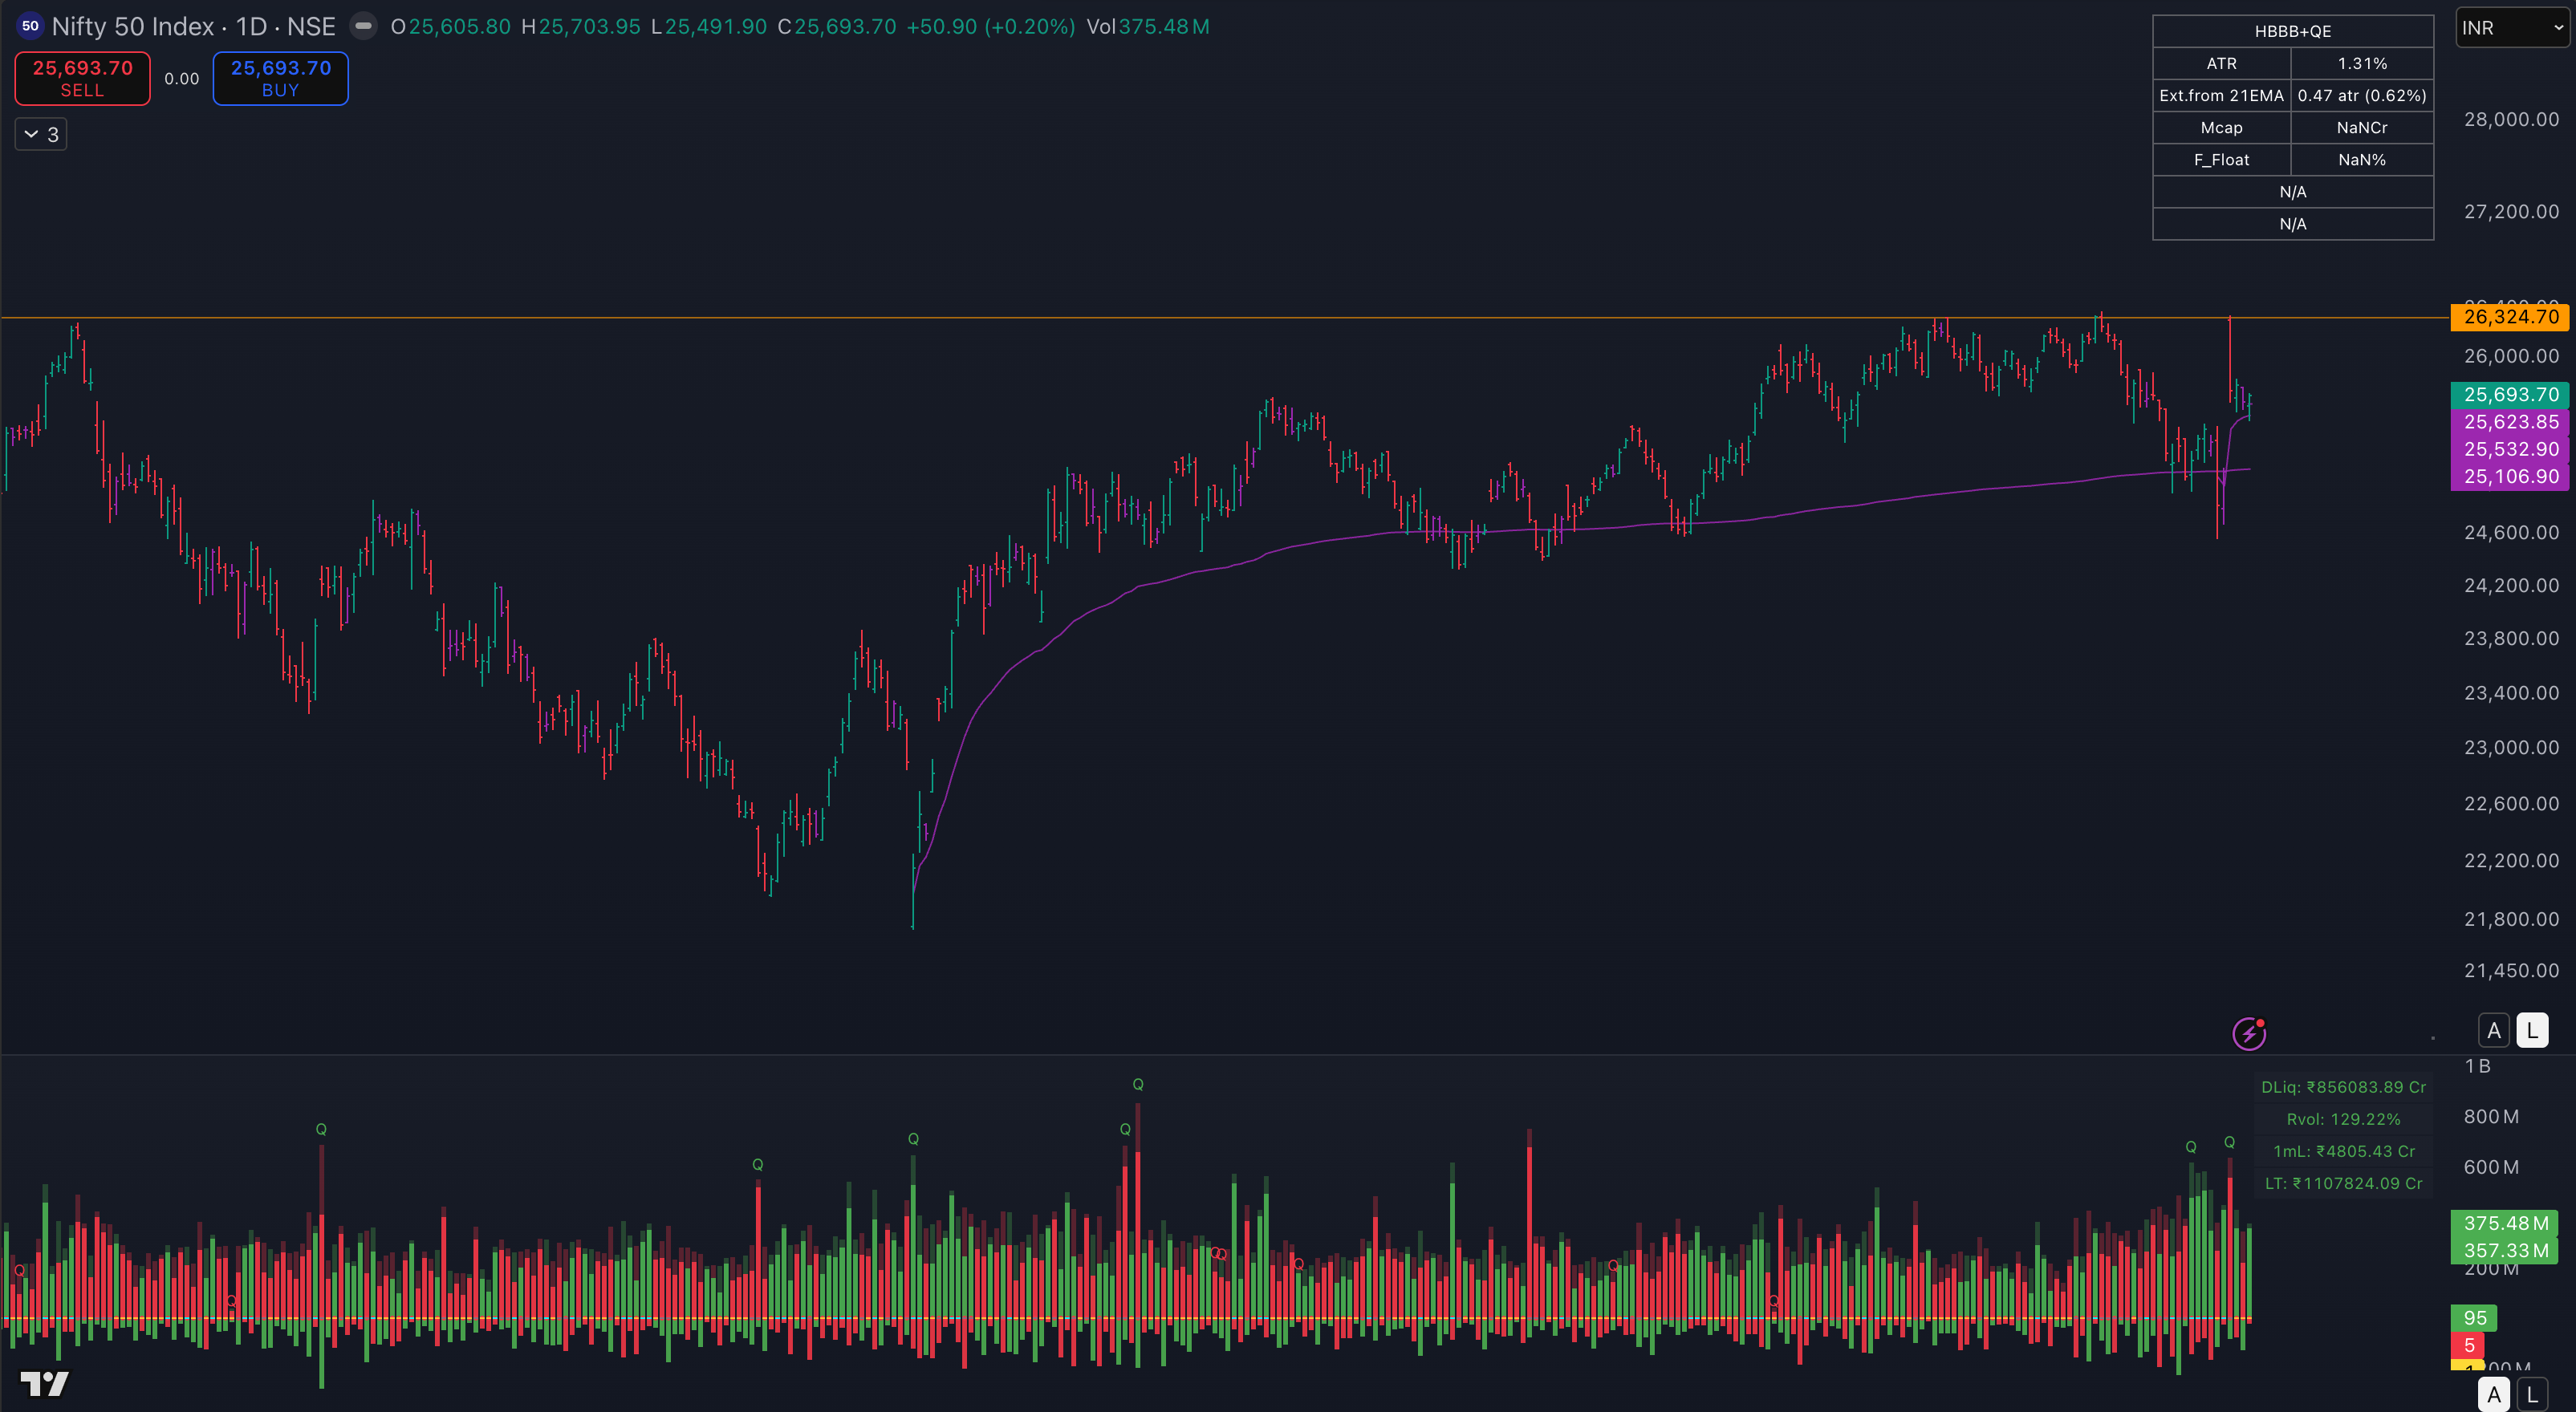
N50:
Nifty gaps up, after finding a high volume backed support at the trendline as well as the confluence of the Vwap anchored at 2025 lows.
This was a major gap up >4%. A rare event.
The fact that we have now pulled back around the Gap Upper Boundary, with tightness and a good tailed close is a positive sign for the bulls.
A higher low here can lead us to another test of the ATH.
As always, we wait for confirmation of the upmove on the breakout of the small base.
Anticipation:
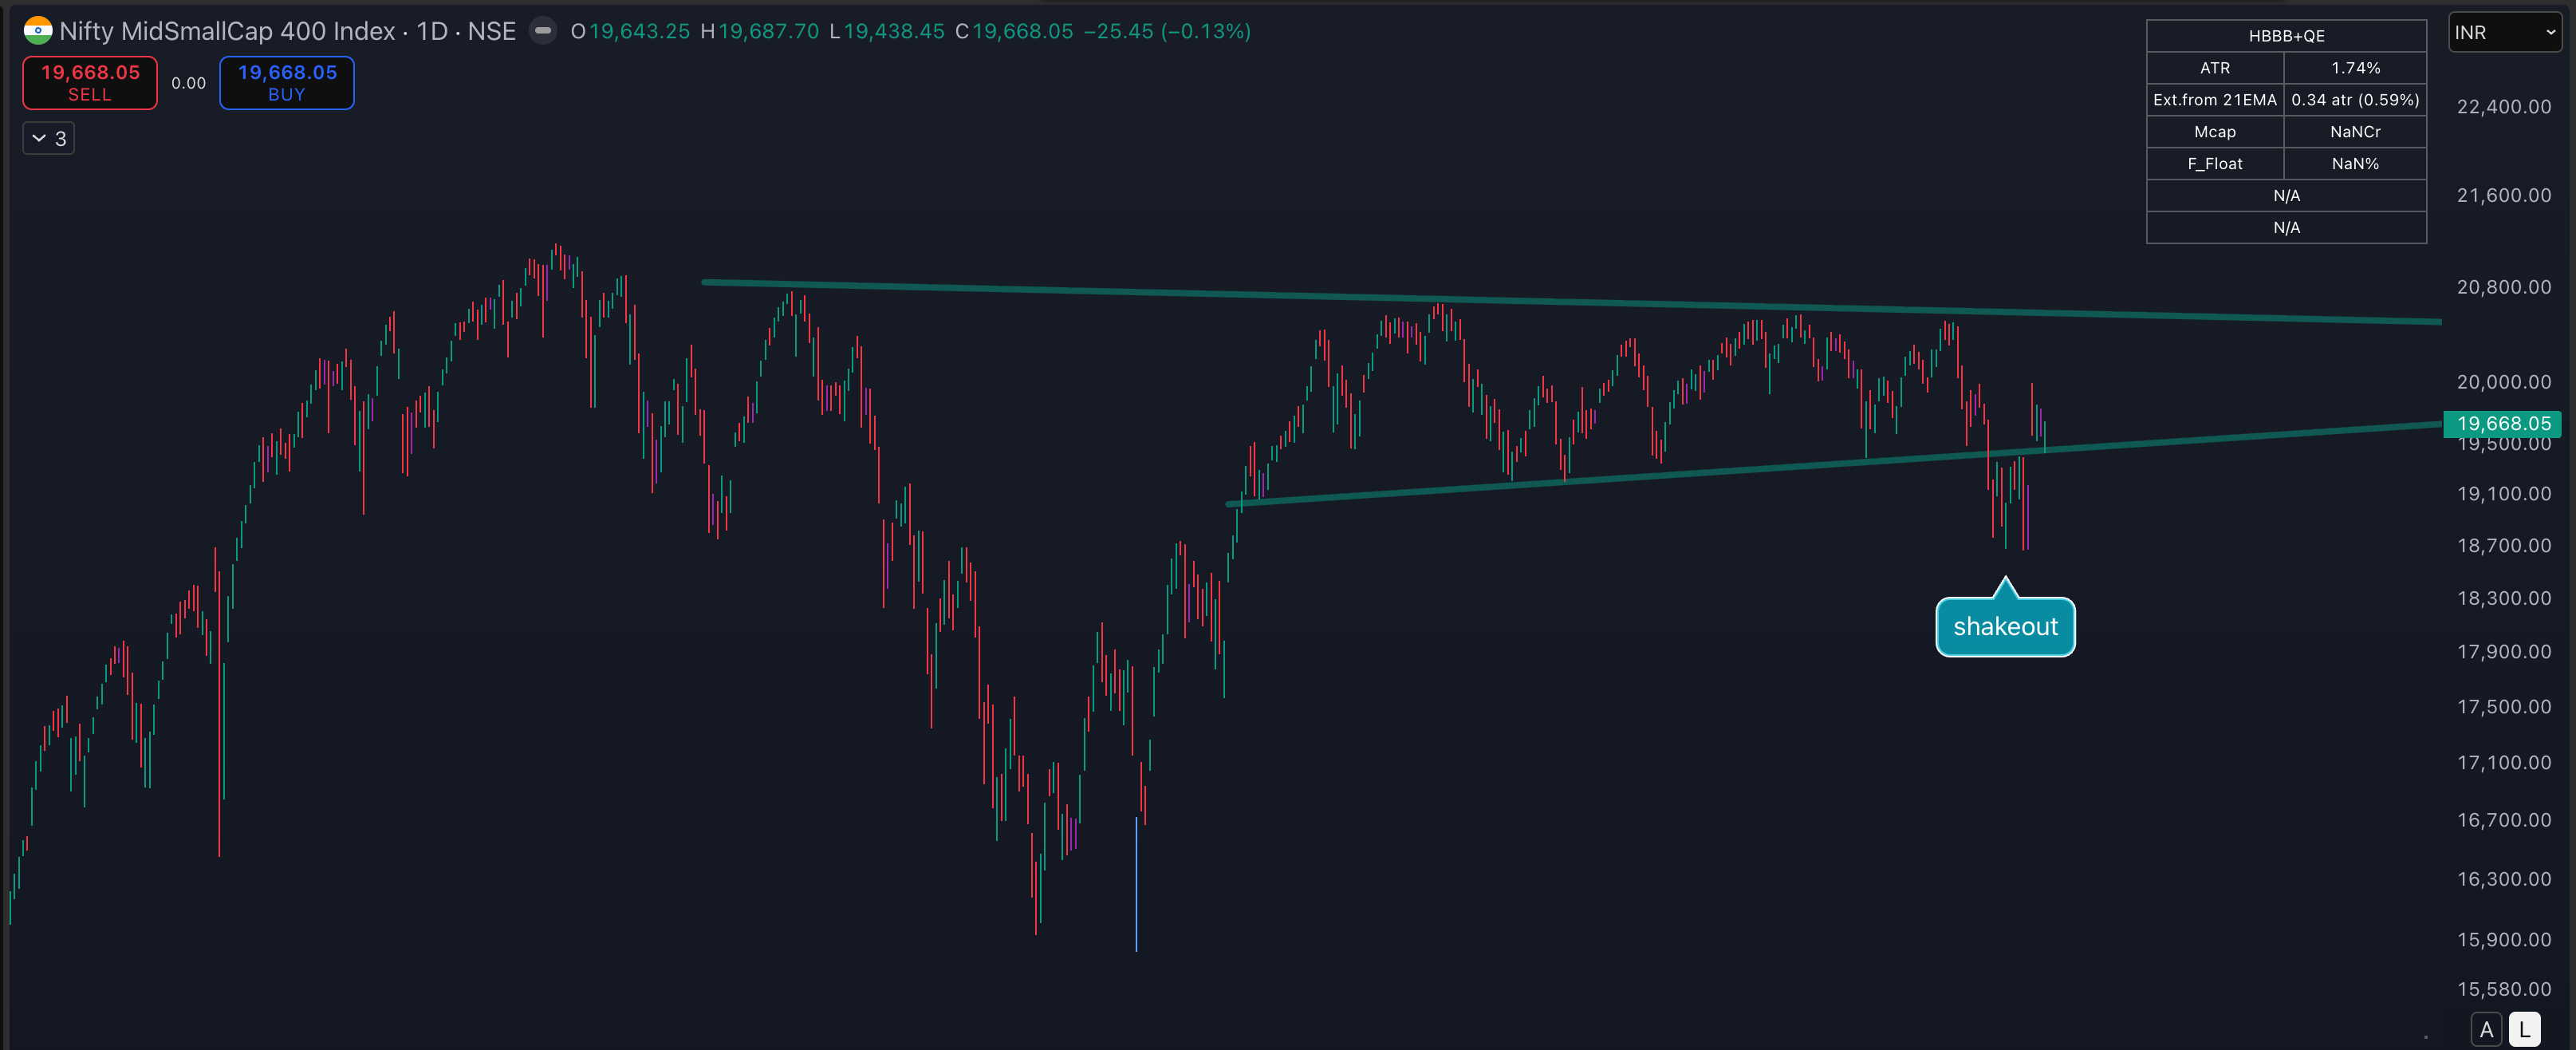
Midsmall broke down from the trendline support and got back in with a Gap up.
It is a shakeout for now.
It retested the gap upper boundary and closed above with a tail. This bodes well for the bulls.
Longterm breadth indicators have recovered from oversold levels and are on the ascendency.
As such, the Friday low can turn out to be a swing low and we may move up to test the ATHs.
Easy money only on a confirmed breakout of the big base.
Positional bias = Still No money (But Hard Money Transition is on the cards)
PS: Anticipations are often wrong, and biases should be adjusted after every candle.
If you dont know this already, I update my Market MATH every day on my website under the BREADTH section. Please check in every day post-market.
A quirky Bull Market indicator:
One that tells you for sure when a bull market is in.
One that eases your anxiety and assures you that the market will NOT take off without you.
One that keeps you from jumping in too big, too soon.
One that keeps your expectations in check, IF you are still trading.
(link to the indicator at the bottom)
Observation: Languishing at the bottom
So is the Bull market in yet?
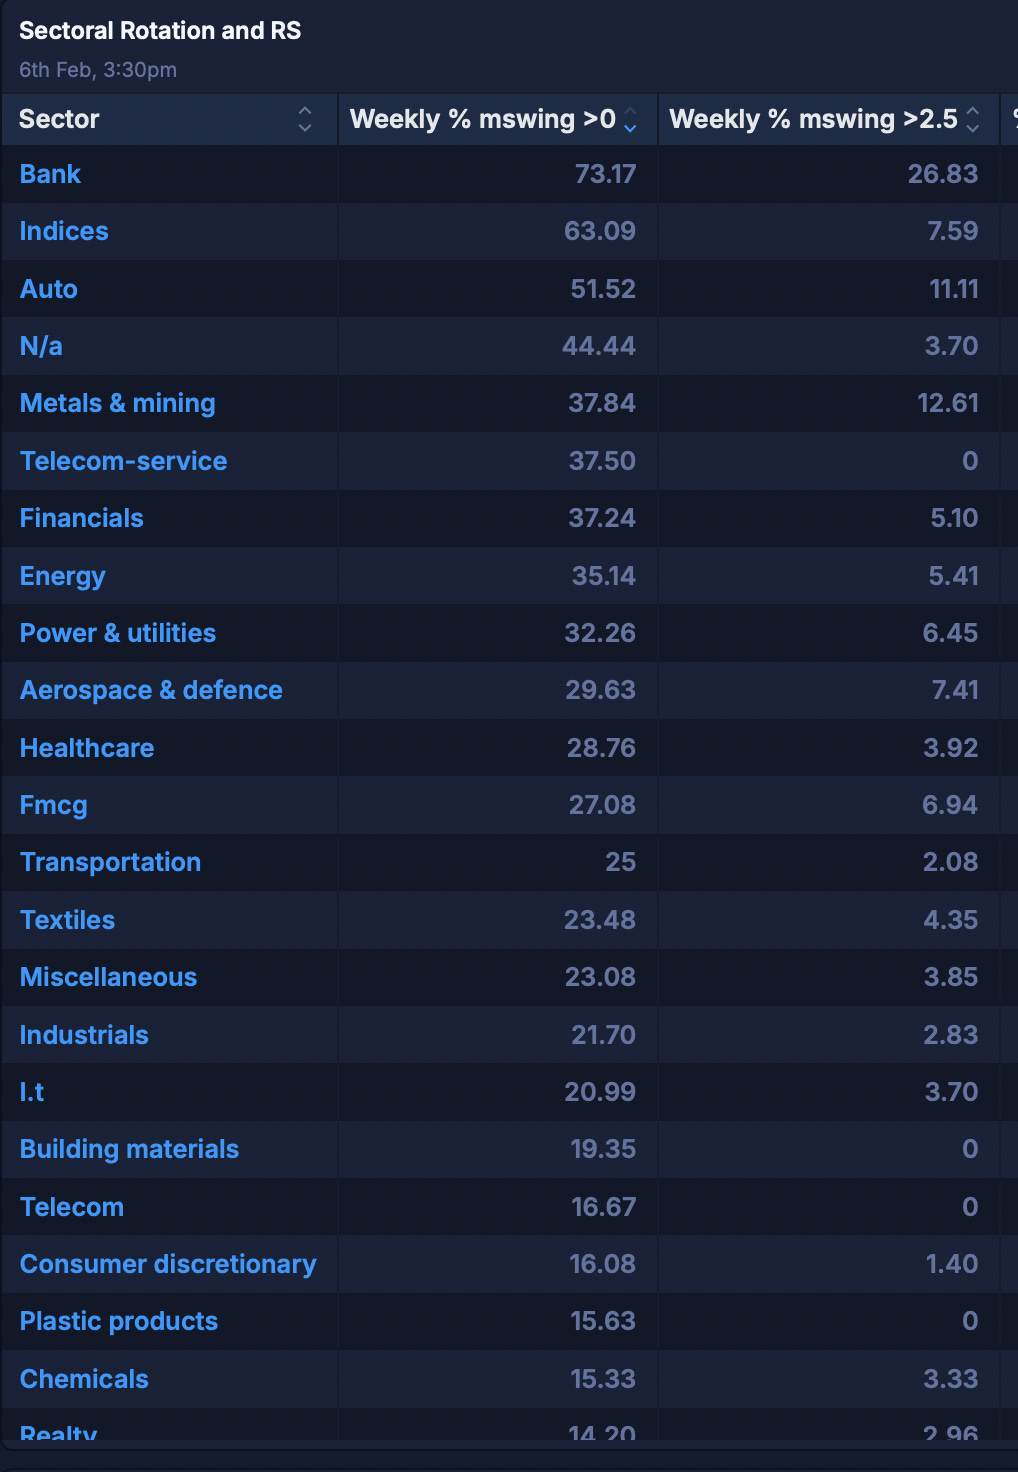
Group Strength:
Sectoral:
Leading groups: Banks
Most Bullish this Week = Textiles, Plastic products
Strength continuation =
Bottom Strength =
Sectors/Groups I like as LRE = Metals and commodities
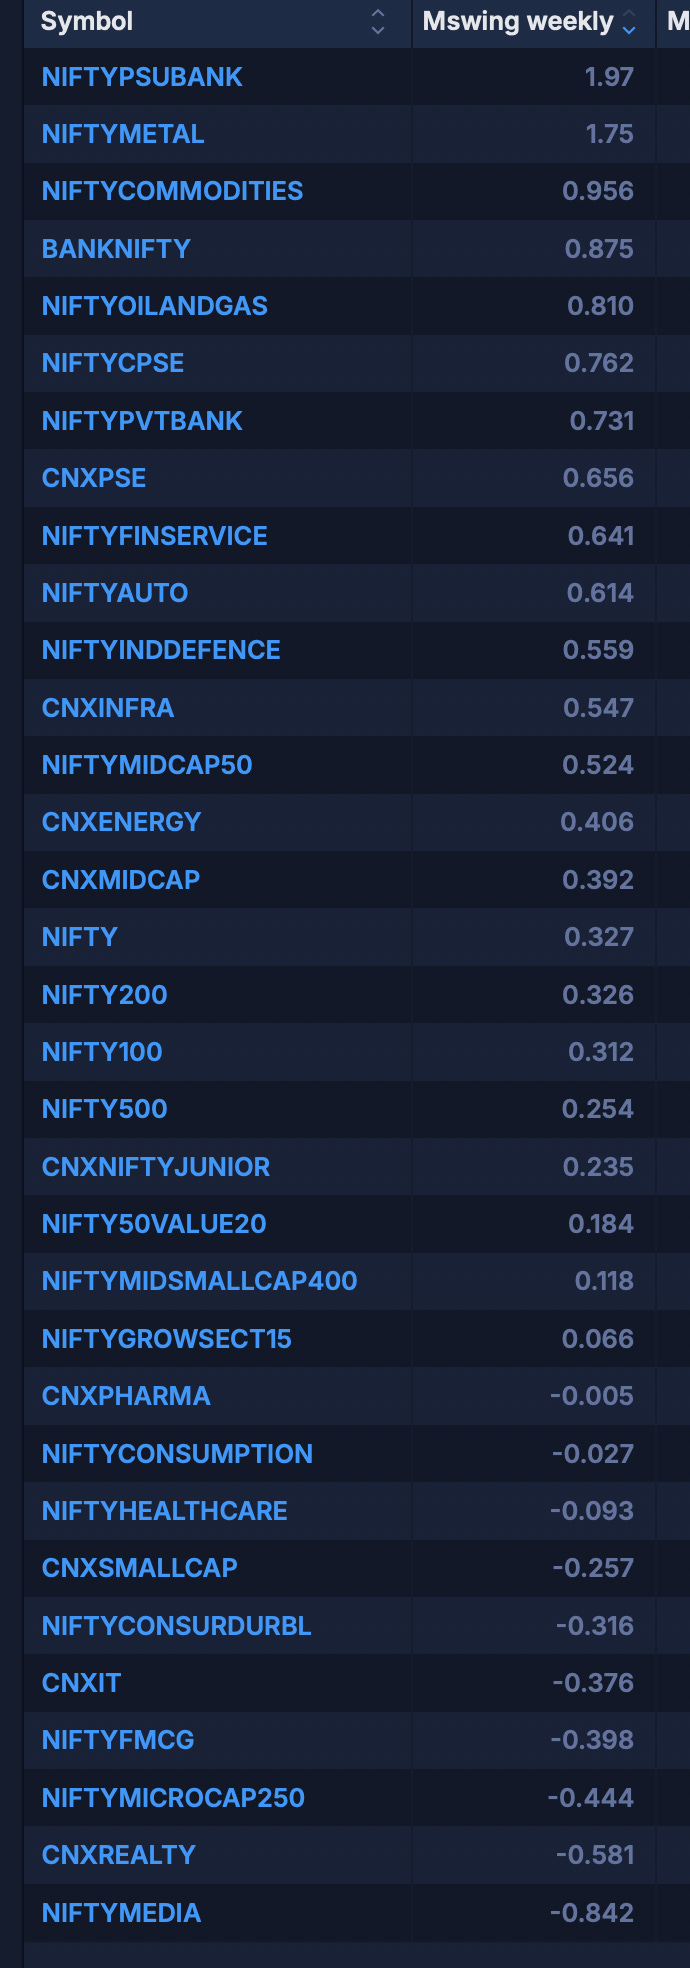
Index:
Leaders = PSU Banks, Metals and commodities, Oil&Gas.
Most bullish this week = Consumer Durables
Indices I like as LREs = metals
Watchlists:
Follow the Strongest Stocks (the RS 100 and RS 100 Liquid watchlists below):
Find Tightness candidates from Tandem Inside bars and Triple Tight Star scan.
Earnings/Tradable Gaps are caught by the scanner TGP (tradable Gap Pivots).
Homma scanners: https://www.sakatashomma.com/scanners
Find the lowest risk entries from the leading strongest groups in my actionable watchlist for the week below:
