Counting VCP Contractions the correct way
and how to adjust them as we go...
"Put you life on fire. Seek those who fan its flames" ~ Rumi
My Aspiring Peak guy,
I hope you enjoyed the last article on VCP.
Today, I am going to show you:
1. How to adjust the Ts? &
How do you count T’s the correct way?
So less Go… (in case you do not know or haven’t read the article, T = contraction)
Adjusting the Ts:
So the T’s in a VCP become smaller and smaller as we go from left to right. Eventually, leaving no space to contract further. At this point, the contraction releases like a spring which brings about the expansion (mostly to the upside).
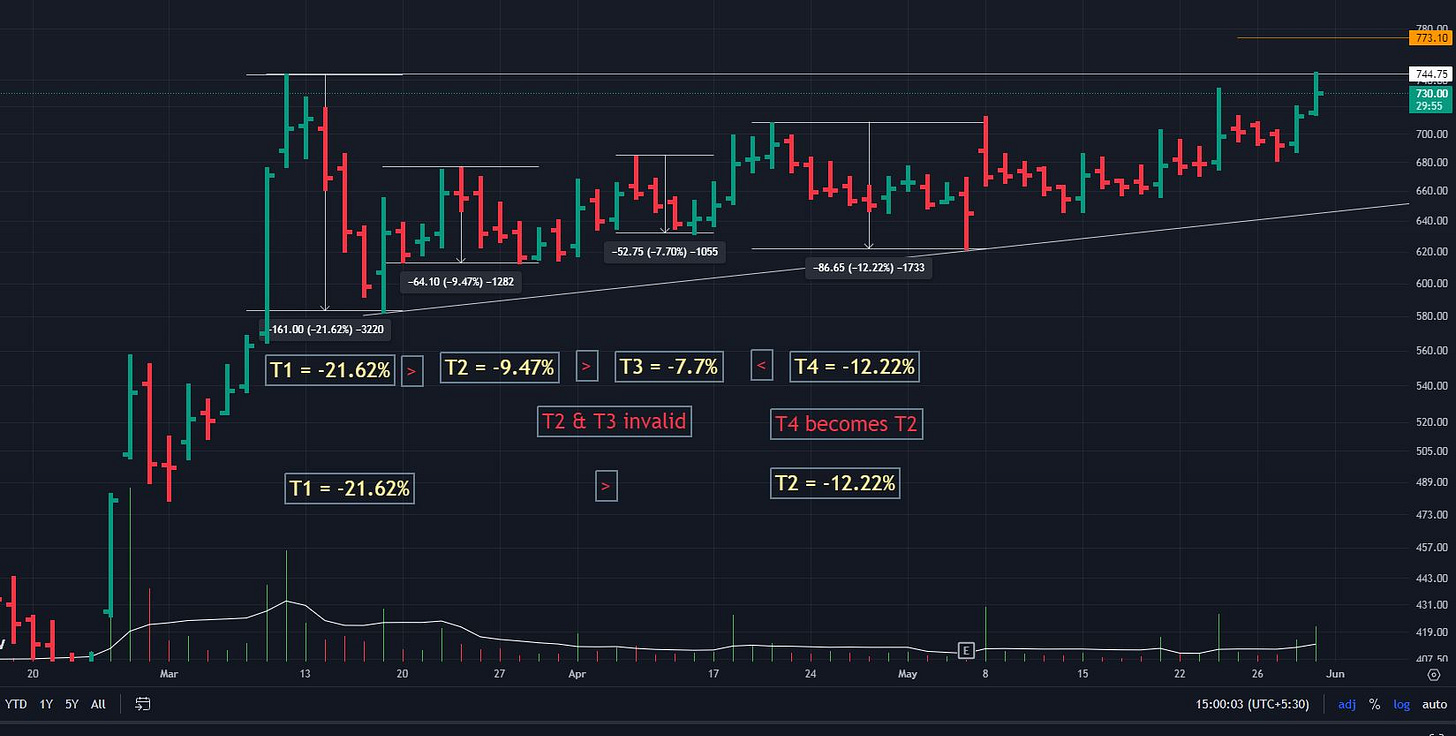
Now your 1st T1 is the frame of reference. For a constructive VCP, the subsequent T2 should be around 40-60% of the previous T1. E.g., imagine T1 is -20%, then an ideal T2 should be around 8-12%.
What happens if T2 is less than less than 8%? Would it still not be considered a valid T?
Yes, it would! But there would be a possibility of a T3 which is greater than T2 (-8%) but smaller than T1 (-20%), in which case the VCP would still be valid but T2 becomes invalid as it would come under T1 and T3 would now be considered as T2.
Confusing? Hell Yes!
Don’t worry at all. I have made a video explaining this in detail using the Olectra chart (image).
And hence you can imagine, that ideally VCPs can have many Ts, as long as the next T is smaller than the previous.
But bro, first tell me how to count them correctly!
Oh Yes. Read on.

How do you count T’s the correct way?
To count a T, you need 2 price points called PIVOTS.
A pivot high, from where the contraction starts to the pivot low where it ends.
A pivot high is the high of a price bar which is flanked by bars with lower highs.
Similarly, a pivot low is the low of a price bar which is flanked by bars with higher lows.
Once you have identified your pivot highs and pivot lows, all you have to do is measure the fall from the pivot high to the pivot low in terms of percentage. You have got your T using a simple measuring tool on the chart.
If you find it cumbersome to manually identify the pivot highs and lows, a simple indicator called Pivot points high low in trading view will automatically mark them for you (see video).
Olectra Greentech Counting Contractions:

That’s it for today man.
Volatility Contraction pattern is a great concept and they occur in almost all constructive patterns. Once you master identifying it correctly, it will greatly level up your trading game. this I am sure of.
I hope this article will help you a little in that.
Sakatas Homma exists to share all and any trading-related information and data with anyone who wants to learn how to trade for free. Furthermore,
If you are a beginner trader, struggling to be consistently profitable. And therefore looking to level up your trading.
I can help you in the following ways below:
The Sakatas Homma TA masterclass for beginners:
A monster course (12-15 hours total). Hourly sessions on weekends. Twice a year.
Please register for the fall 2023 course using the link below.
https://docs.google.com/forms/d/e/1FAIpQLScfnQA1w9WDTtTAPEHIqzkS9jhRSZFA1BZXuWRZ5JPZ3Qfu8g/viewform
Watch my 1st session of the spring 2023 batch.
Homma Private Access membership:
HPA is a subscription-based educational service (on WhatsApp), where you will learn about my trading style, watchlist, set-ups, & overall process in real-time. You will receive daily updates and weekly live sessions.
Monthly (1000/- INR) and yearly memberships (6000/- INR) are available.
UPI payment & WhatsApp @ 9481506784. 50% off on the 1st Month.
This is all for this weekend,
I will see you in the next one. Till then,
Don’t stop asking those stupid questions.
~ Homma
Some Peak Scanners for you:
Pullback to 10/21 ma: https://chartink.com/screener/copy-shpb1021
VCP (long-term timeframe): https://chartink.com/screener/shvcp-epic-modified
