In continuation of what we discussed last week about Bullish Reversal patterns:
Bullish Reversal Patterns/bases: The earliest entry point for a trend follower.
Everything is cyclical. Every (or shall I say most) uptrend reverse (Bearish reversal). And so does every downtrend (Bullish Reversal). Most of these reversals are brought about by reversal bases (most take the shape of geometrical patterns and hence are named after them).
Today, I will discuss the second pattern/base in the list.
The Symmetrical Triangle
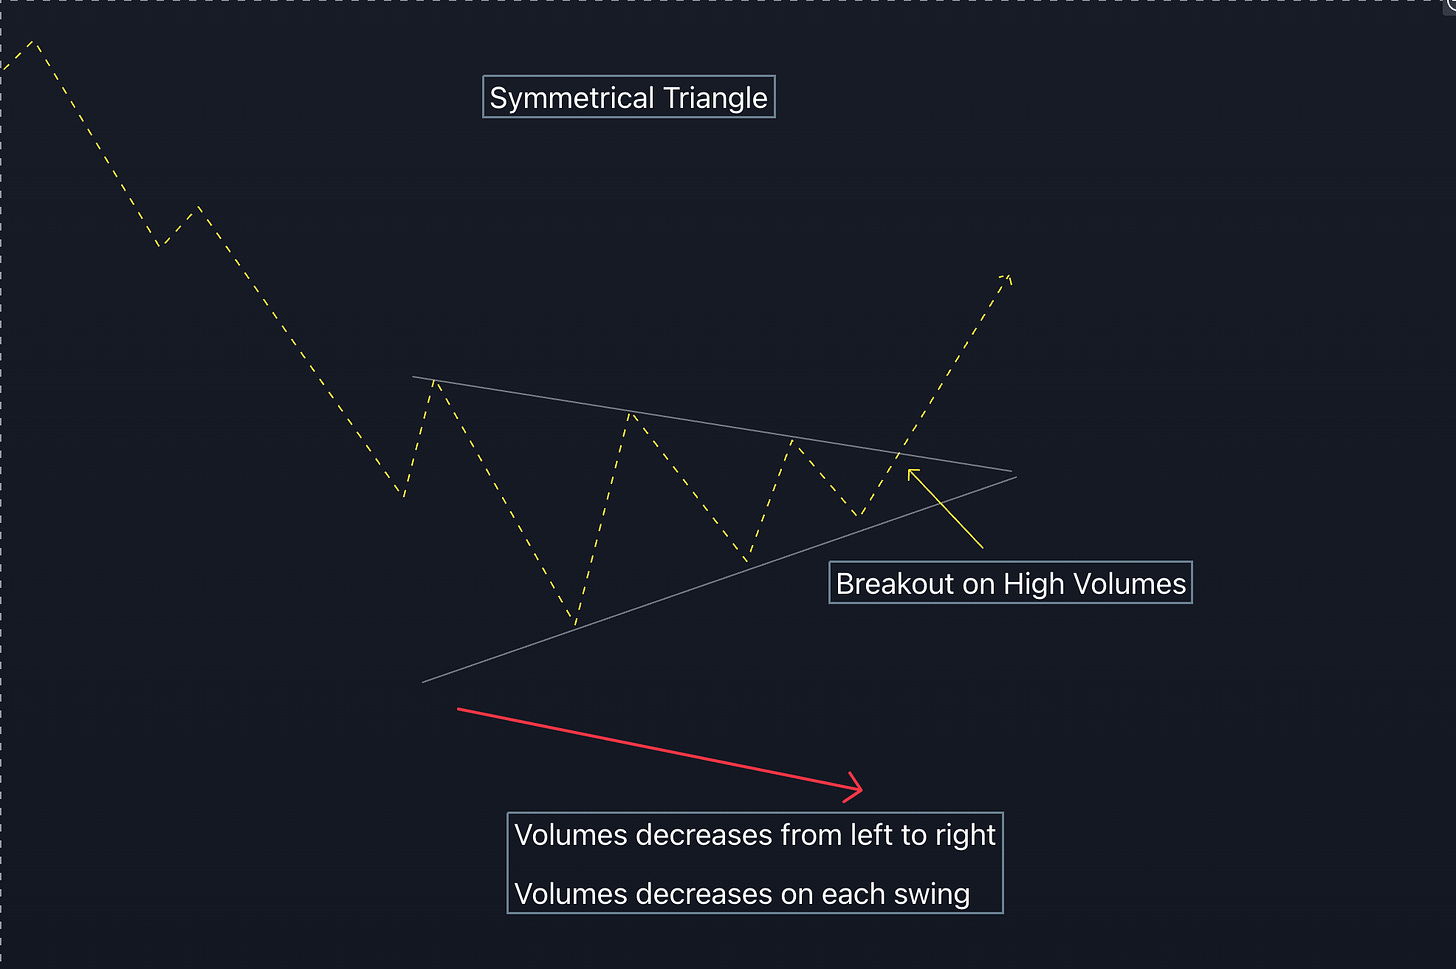
Symmetrical Triangle :
There are at least 2 clear swing highs which are lower-highs. This makes a downward-sloping resistance.
Whereas the swing lows inch up higher forming a rising trendline support.
Rising swing lows mean the failure of bears to push the prices lower, while
Declining swing highs mean the failure of bulls to push the prices higher.
There is a contraction of volatility (this pattern is therefore often called a coil).
The further the price contracts inside these 2 converging lines, the equilibrium between buyers and sellers is threatened to be disrupted more easily.
Soon (even before the price reaches the apex of the triangle), either the buyers or sellers win the battle and the price breaks out (or breaks down).
Symmetrical triangles as bullish reversal patterns are much rarer than Ascending Triangles.
(They are more common as continuation bases).
Volume signature:
Volumes should dry up from left to right on the downlegs.
The breakout must be accompanied by relatively high volumes for a higher probability of follow-through.
Breakout should come around 2/3rd of the length of the symmetrical triangle (definitely before the apex).
The nearer a breakout is to the apex, the more failure-prone the reversal.
Let's look at a few examples.
Examples:
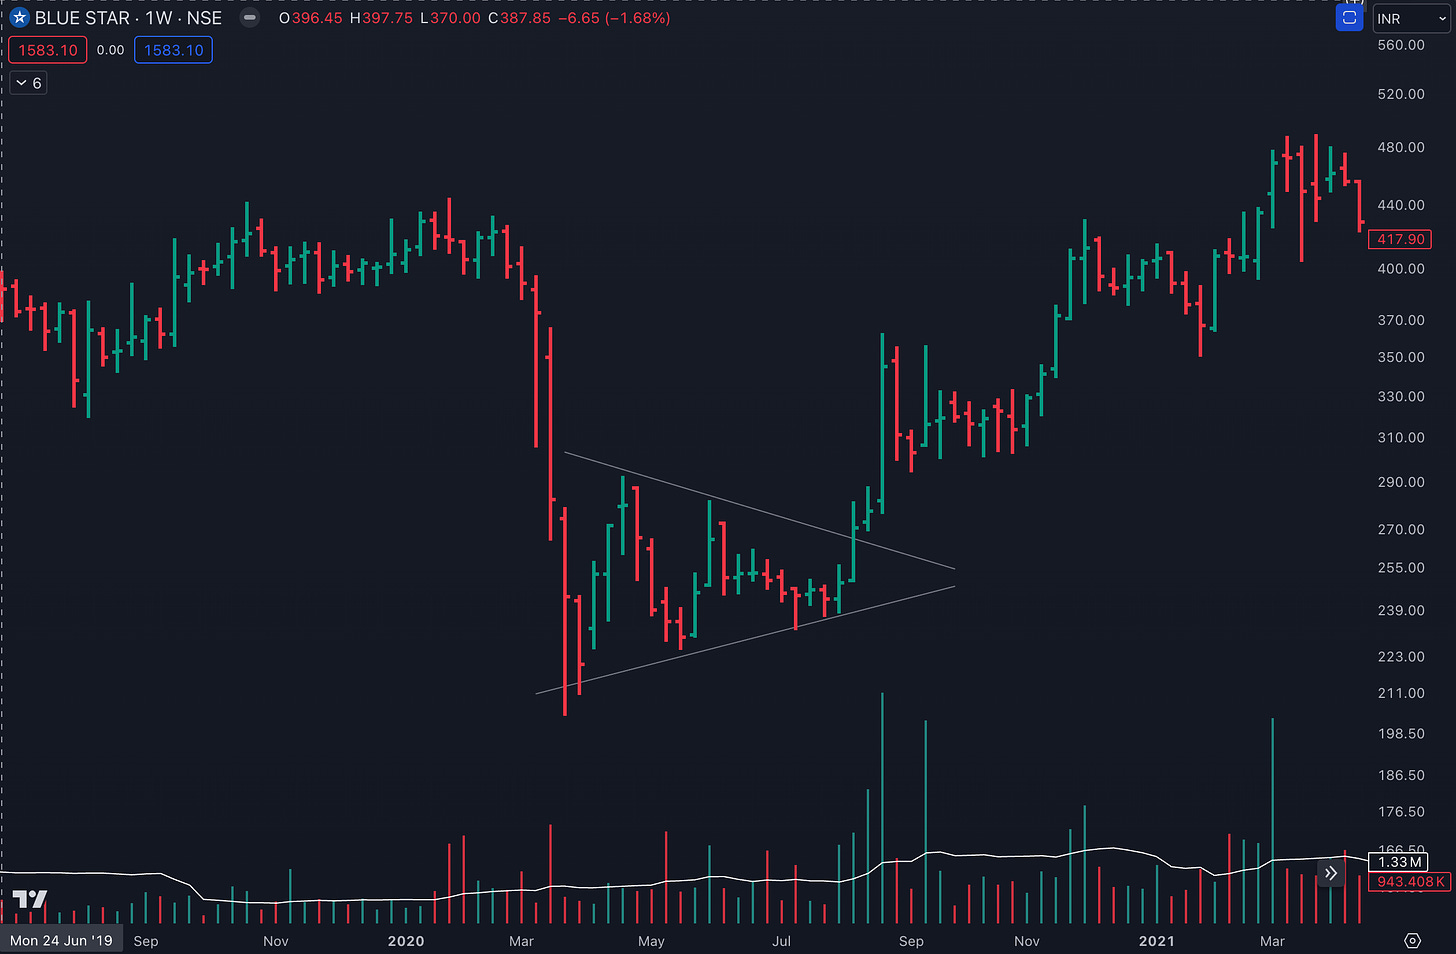
Bluestar Weekly: Post covid reversal
Notice the high breakout volumes.
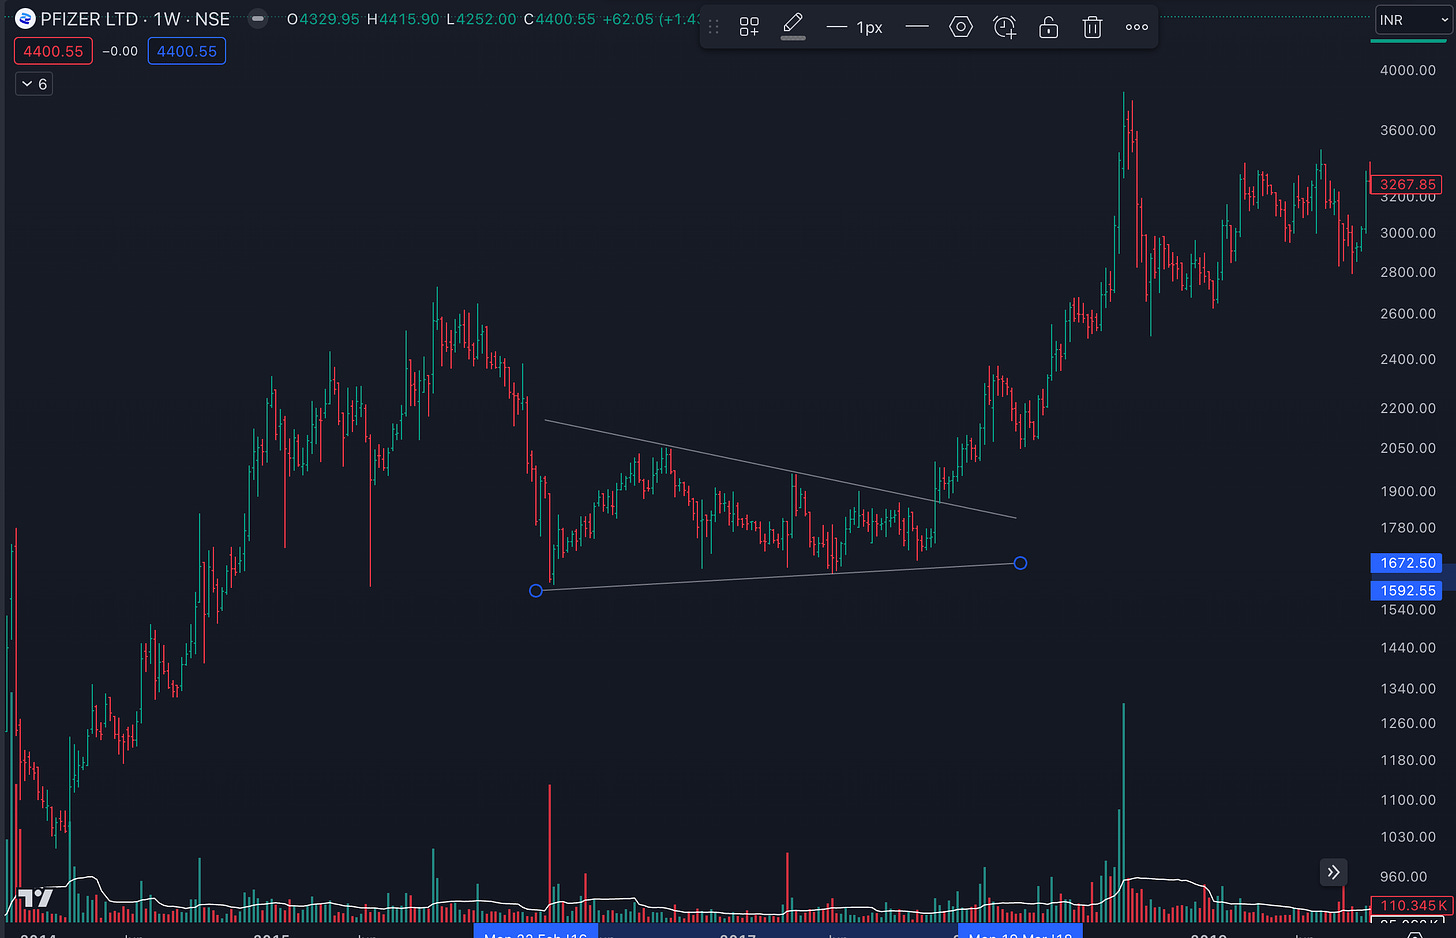
L&T Finance weekly reversal:
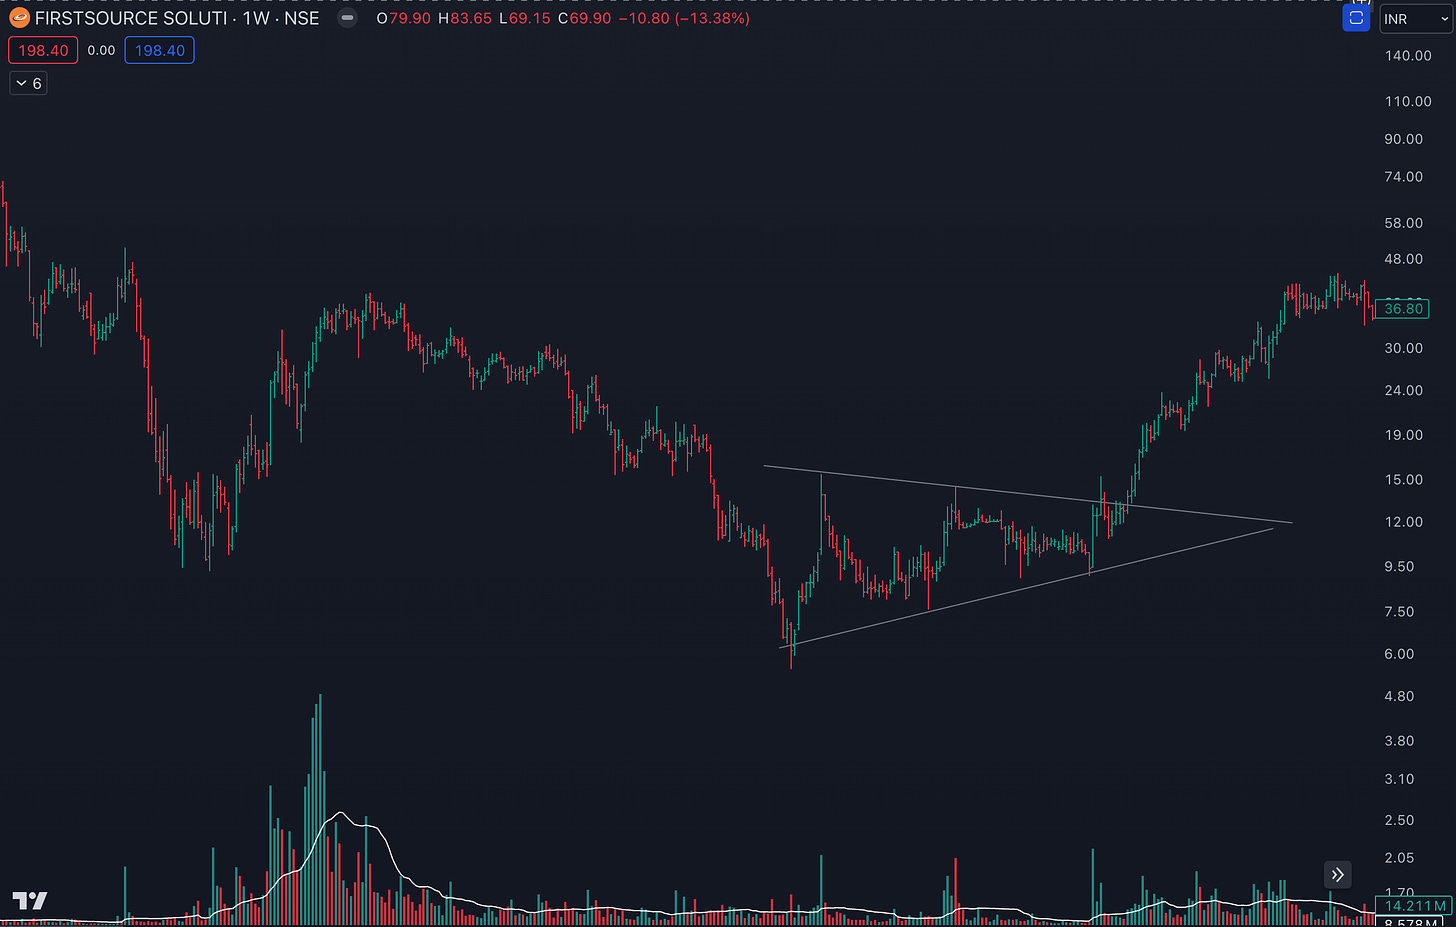
FSL:
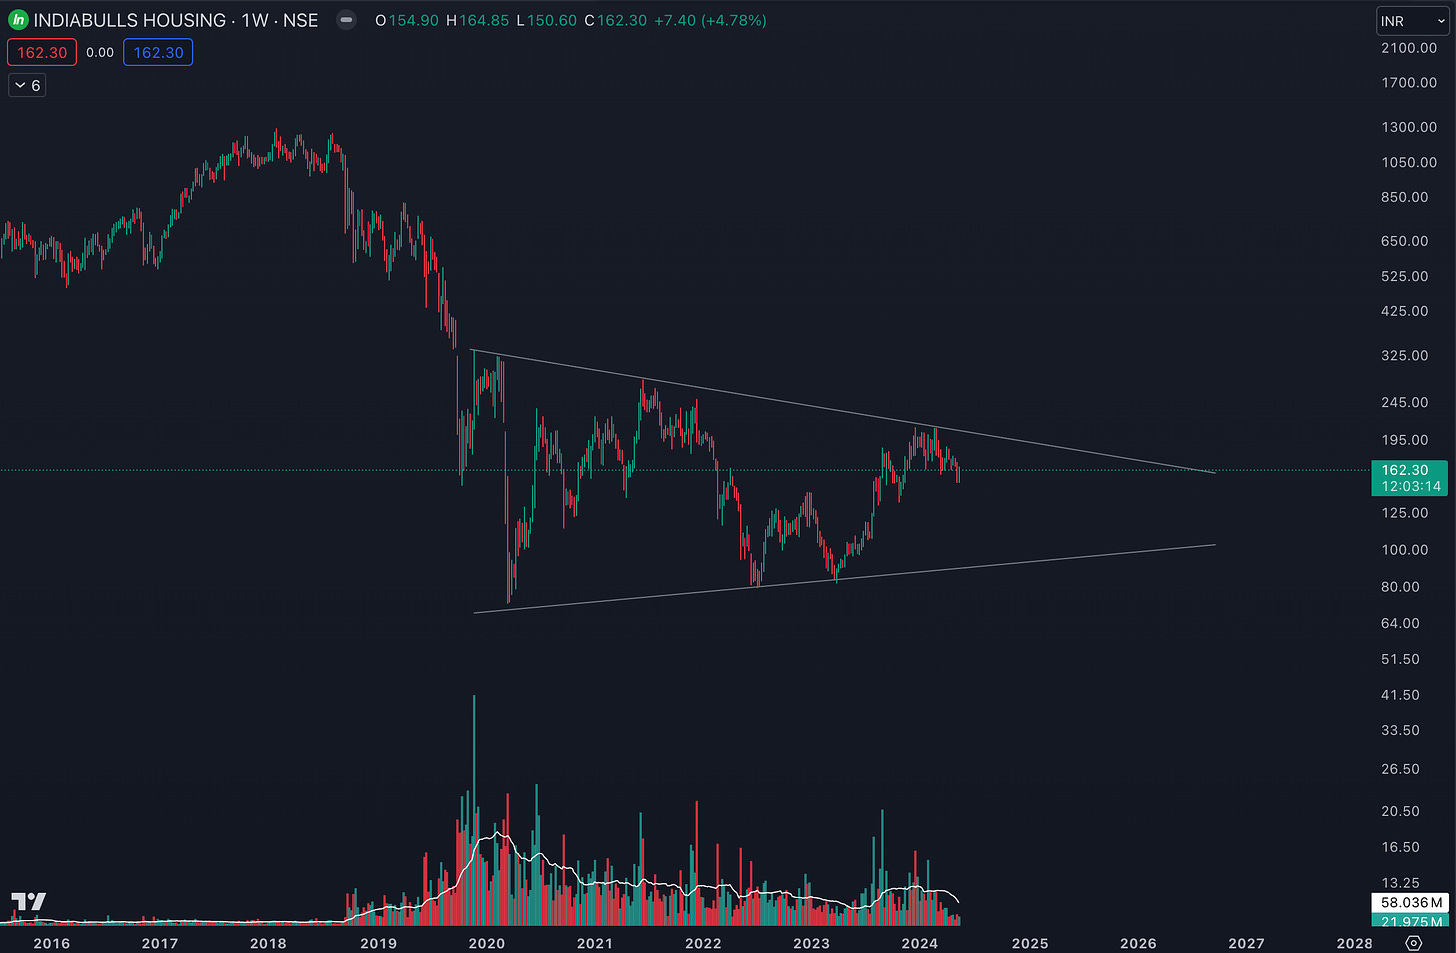
IBull Housing Finance: Possible Symmetrical Triangle Reversal Base
That’s all for today.
A fundamental knowledge of these market structures is essential to the success of a price action trader.
The Sakatas Homma TA masterclass for beginners is designed to help absolute beginners level up their technical game (details below).
The next step would be knowing yourself (your timeframe and risk tolerance) and then developing a TRADING SYSTEM that is personal and unique to YOU.
I show my process and system day in and day out.
And guide the Homma Private Access (HPA) members to build their own.
HPA has been the shortest way towards being consistently profitable for more than 200 traders/investors (details below).
Join the Sakatas Homma TA masterclass for beginners:
A complete course containing 8 Hourly sessions. Once a year.
To register for the next live masterclass, please fill out this form.
Watch the 1st session of the Autumn 2023 masterclass.
To access the full 8 sessions, contact us via WhatsApp @ 9481506784
Homma Private Access membership:
HPA is a subscription-based educational service (on WhatsApp). Benefits include:
Daily Market Breadth, Momentum, Sector Rotation, and Relative Strength Update.
Access to all my scanners including the BBB (buy before breakouts) scanner, and the Homma Khela Hobe 2.0 scanner.
Access to my proprietary Breadth-Momentum-Relative Strength & Sector Rotation dashboards.
Access to my Trading view indicators: Homma Khela Hobe, Buy before Breakouts (BBB), Homma Endgame, etc.
Access to live Telegram alerts to Homma Khela Hobe, Homma Pullback, and TGP scanners.
HPA Weekly: Hourly weekend deep dives and Q&A.
1-year access to The Technical Take premium.
Live alerts to high-risk-reward setups breaking out.
Live updates on my portfolio and the trading setup rationale.
Access to my high probability watchlist.
Yearly membership of 15000/- INR only.
UPI payment & WhatsApp @ 9481506784.
Yours
Sakatas “Bullish reversal” Homma.



Good tool. Bajaj Consumer, Biocon showing similar pattern