"There's more than one way to skin a cat"
Out of 2000 NSE stocks available, how do you zero in on those handful of stocks you decide to put your hard-earned money into?
There is no correct way to do this.
And just like everything else in trading, this also depends on your personality, style, timeframe, and the amount of time you can actually devote to it.
But whatever that may be, you need a system to think about it.
In this article, I will tell you about the 3 possible “systems” you can go about STOCK SELECTION.
Before we get into it, I have to say that the best stocks in your Portfolio should show high Relative Strength. And so it goes without saying that whatever system you choose to select your Stocks, they should show a higher Relative Strength w.r.t the general Market.
Stock Selection can be approached in the following different ways:
Scan for Setups:
In this, you are scanning for all those stocks that fulfill your setup. Now your setup can be anything. It can be a pattern, a decrease in volatility and volume, or just a moving average cross, a bunch of rules basically.
For eg: If you trade high-tight flag (HTF) breakouts, you will have to find stocks that are making flags and are ready to break out.
You can do this manually or via a scanner that scans for Flags. Simple.
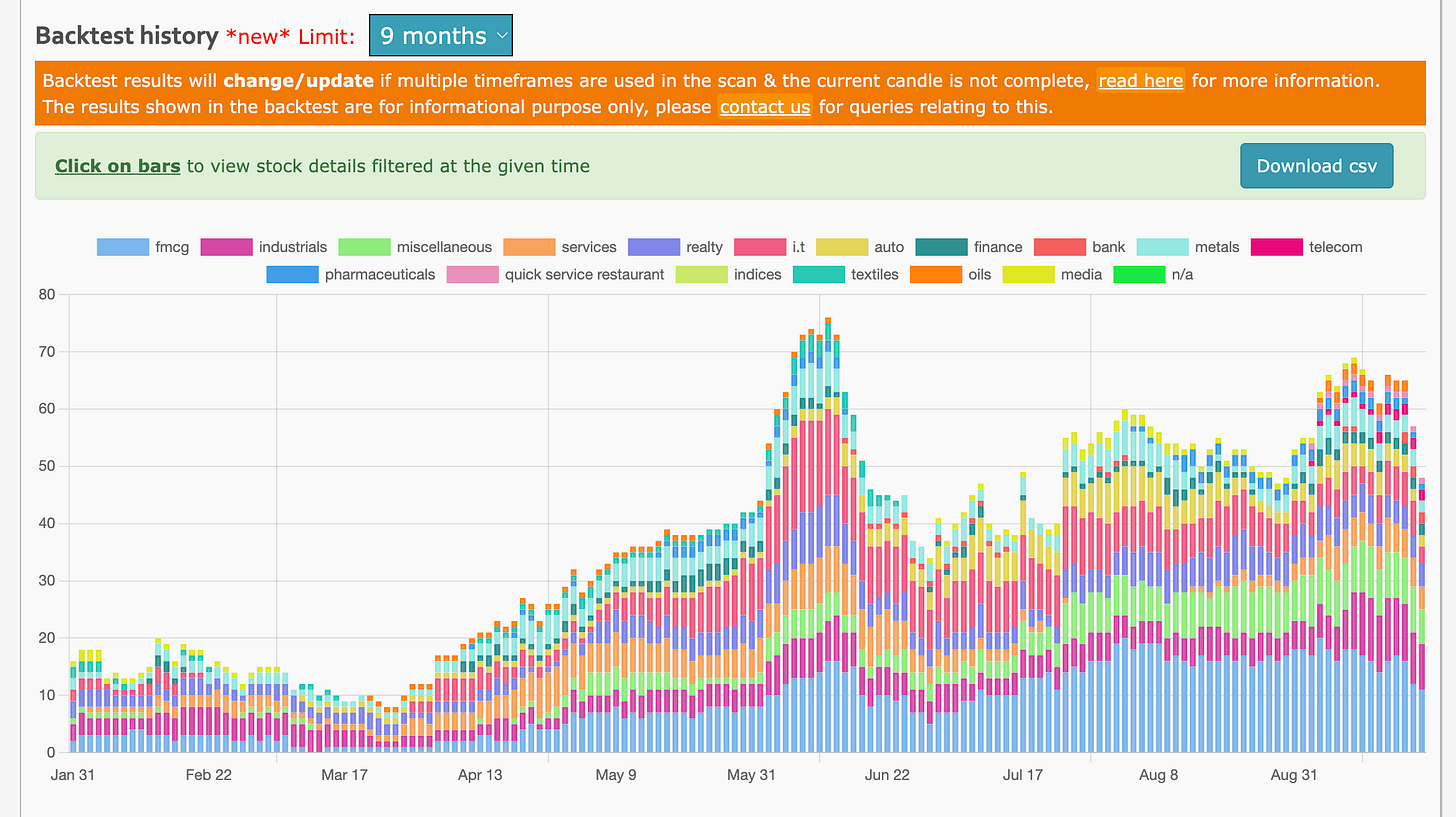
For example, there are 48 HTFs in the NSE universe right now:
Scan for Strength:
You can also scan for stocks displaying strength. Here are some of the ways to look at strength.
a) 52-week highs/ 3-month highs/ 1-month highs:
A stock hitting these numbers simply shows that they are strong and have been in that timeframe.
A stock that will become a 10X will first have to hit a 1-month high before it hits a 3-month high before it hits a 52-week high and then go on to hit a 52-high numerous times in its journey to being a 10-bagger.
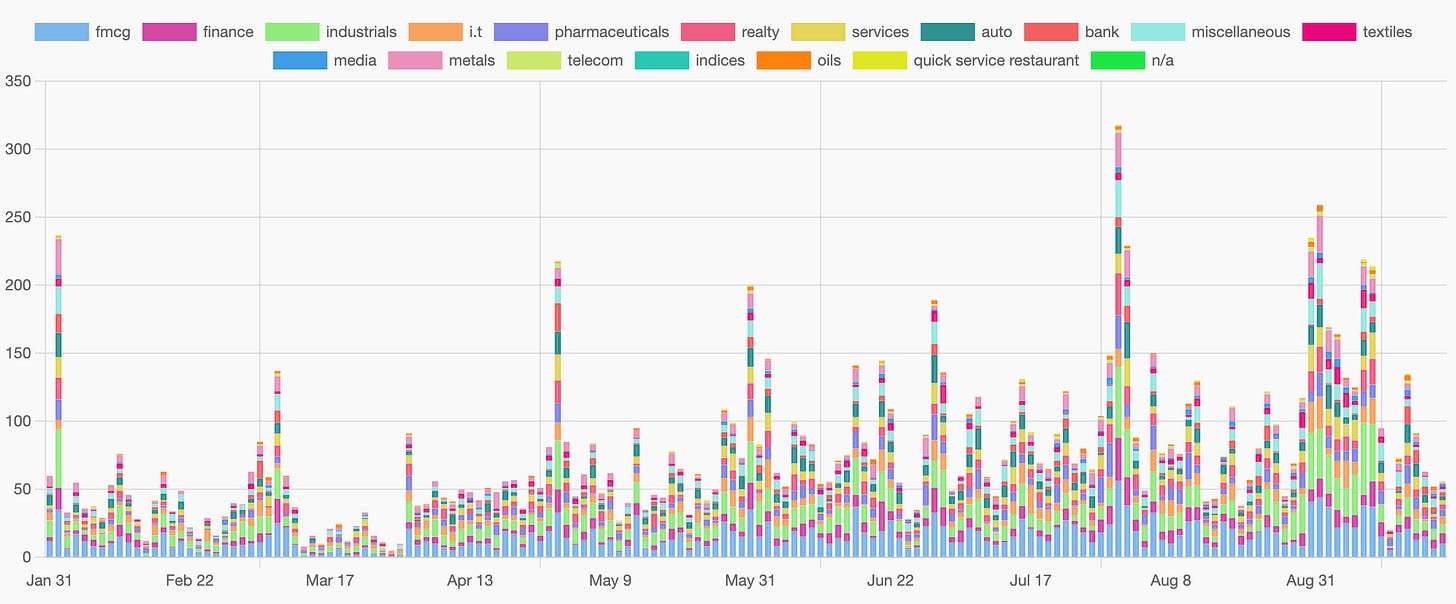
There are 30 stocks hitting 52-week highs, 42 stocks hitting 3-month highs, and 56 stocks hitting 1-month highs right now.
(PS: I have to mention that for some investors, scanning for weakness rather than strength floats their boat. So they scan for weakness (eg. 52-week lows).
1-month/3-month/52-week high scanner below:
https://chartink.com/screener/1-3-52-week-high
Scan for an Entry TRIGGER:
This is slightly different from a setup. A trigger is the final condition of a setup and a setup can have multiple conditions (Some setups may also have just one condition. Yes. Well, I don’t make the rules).
For eg. You can scan for a Flag, but the entry trigger can be a breakout of the high of the Flag pole.
In this system, you just scan for that TRIGGER.
A breakout of the Bollinger bands can be a trigger.
Moreover, you can use the same entry trigger for multiple setups.
So,
These were the 3 major approaches to Scanning and Stock Selection.
Every approach by any trader anywhere on Earth will fall into one of these 3 bins.
Also, All 3 can be done MANUALLY or using a SCANNER.
They also don’t have to be mutually exclusive.
You can first scan for Strength (e.g. 52-week high). From that list, you can then scan for your set-up(HTF for example) and lastly look for the entry trigger.
For some of you, a pattern may not be important. Simply scanning for strength may be enough which will already put you into the strongest stocks.
For some of you with a shorter timeframe, all you might need is may be the trigger.
Whatever floats your boat man.
But you get the idea right?
Yes?
What’s that then?
“Have a system”. Damn right.
But the more important question then is which system is the best for you?
Which system is the best for you?
This depends:
Are you someone who trades less and only trades when everything aligns in a straight line?
Are you someone who can create and manage a watchlist of stocks?
Or do you prefer a hit-and-run?
What is your trading timeframe?
How much time can you devote to scanning and trading?
All of these answers will influence which scanning and stock selection system will be the best for you.
I will chat more about this with you. But for now, I am going to stop here.
If you are not sure about the best way of SCANNING for you, my masterclass might be of real help (details below). And if you wanna see how I zero down on stocks week in and week out, I do that with my private group HPA (also details below).
The Sakatas Homma TA masterclass for beginners:
A monster course 8-10 hours. Hourly sessions on weekends. Twice a year.
Please register for the next batch using the link below.
https://docs.google.com/forms/d/e/1FAIpQLScfnQA1w9WDTtTAPEHIqzkS9jhRSZFA1BZXuWRZ5JPZ3Qfu8g/viewform
Watch my 1st session of the spring 2023 batch.
Homma Private Access membership:
HPA is a subscription-based educational service (on WhatsApp). Benefits include:
Daily Market Breadth Update.
Access to my scanners, dashboards, and charting layouts.
Weekend hourly session and Q&A.
Live updates on my portfolio and the trading setup rationale.
Live updates of key setups I am tracking.
Yearly membership of 12000/- INR only.
UPI payment & WhatsApp @ 9481506784.
Yours
Sakatas “scanning” Homma.


